
New Loans Disbursed — Power BI Report Sample
A three-page Power BI report sample for lending analytics, shown as mockups rendered from synthetic data: an Overview of new loans disbursed by month, product, channel and region; a Loan Officers page with a performance matrix; and a Pipeline page with the application-to-funding funnel. Built the way EPC Group builds lending dashboards for banks and credit unions, with row-level security and a certified semantic model.
Key Facts
- Microsoft enterprise consulting since 1997; 6,500+ SharePoint and 1,500+ Power BI deployments.
- Compliance-native delivery across HIPAA, SOC 2, FedRAMP, FINRA, CMMC, and GxP environments.
- Microsoft Solutions Partner with experience across core current designations.
- Senior architect named on every engagement Statement of Work.
- Engagement Operating Model: published seven-phase Microsoft project management methodology.
- Free initial consultation; fixed-fee scoped Statements of Work.
Last updated by Errin O'Connor, Founder & Chief AI Architect, EPC Group
This sample is a three-page lending-analytics report built the way EPC Group builds them for banks and credit unions: one Overview page a CFO or chief lending officer reads in a minute, one page per operating question underneath it. The screenshots below are mockups rendered from synthetic data for a fictional institution (Northwind Community Bank); no client data appears on this page.
Page 1 — Overview: how much was disbursed, where it came from
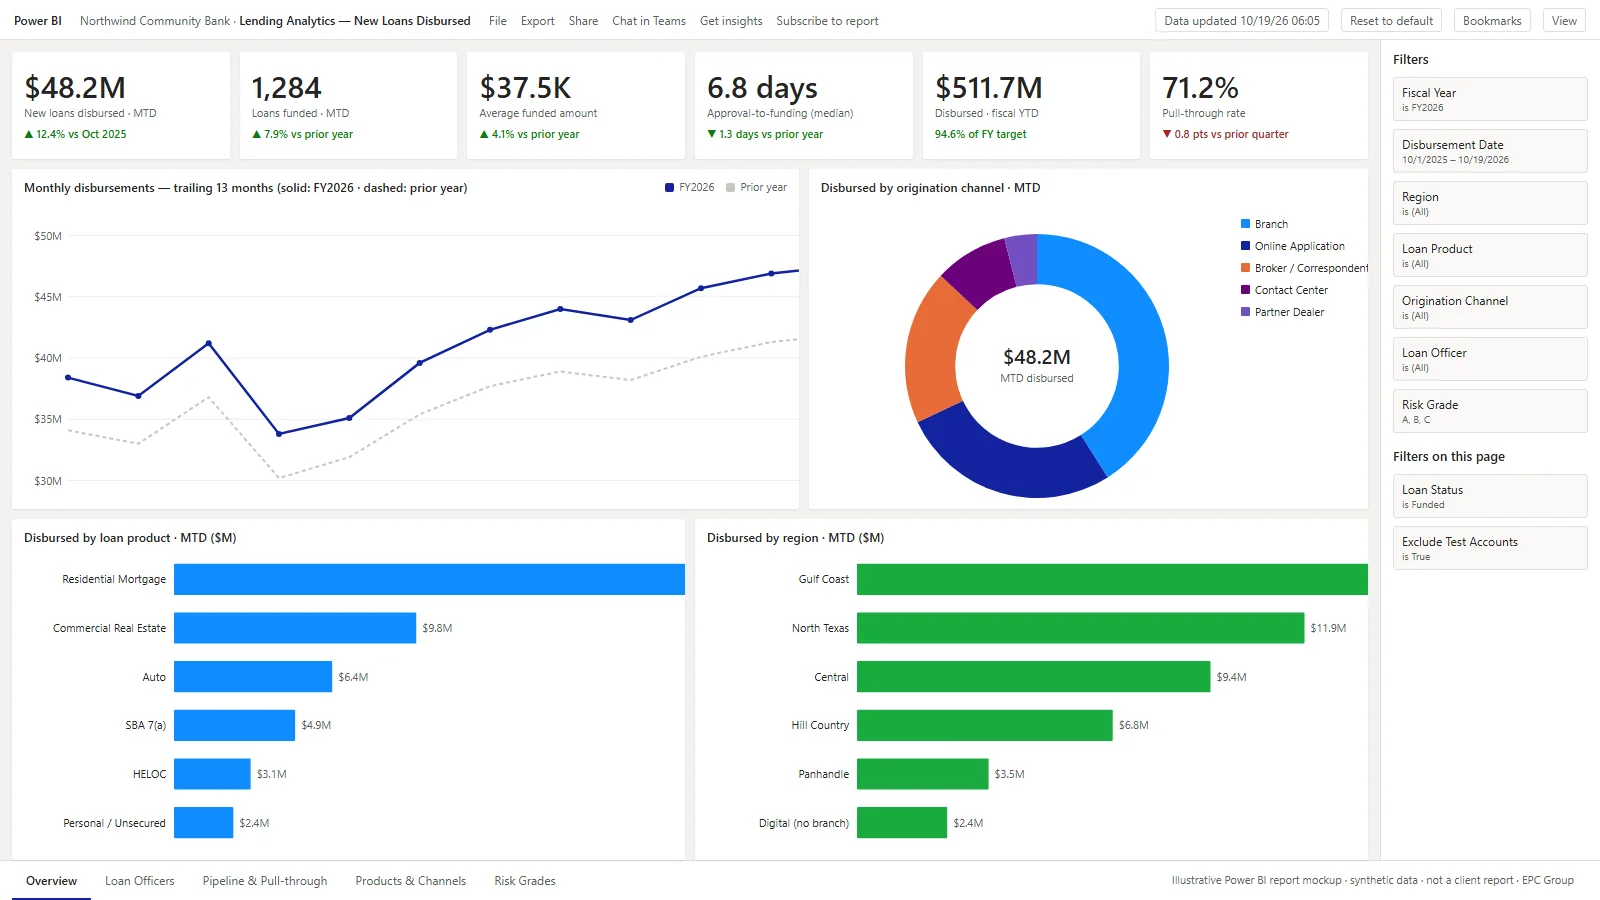
- Six KPI cards answer the first questions a lending executive asks: month-to-date disbursed, loans funded, average funded amount, median approval-to-funding days, fiscal-year-to-date against target and pull-through rate — each with a year-over-year or prior-period delta.
- Trailing 13-month trend plots this fiscal year against the prior year so seasonality (the January dip, the spring ramp) reads at a glance.
- Channel, product and region breakdowns use the same month-to-date measure, so every visual on the page reconciles to the headline number.
- Filter pane carries fiscal year, disbursement date, region, product, channel, loan officer and risk grade; page-level filters pin the view to funded loans and exclude test accounts.
Page 2 — Loan officers: who is funding, and how fast
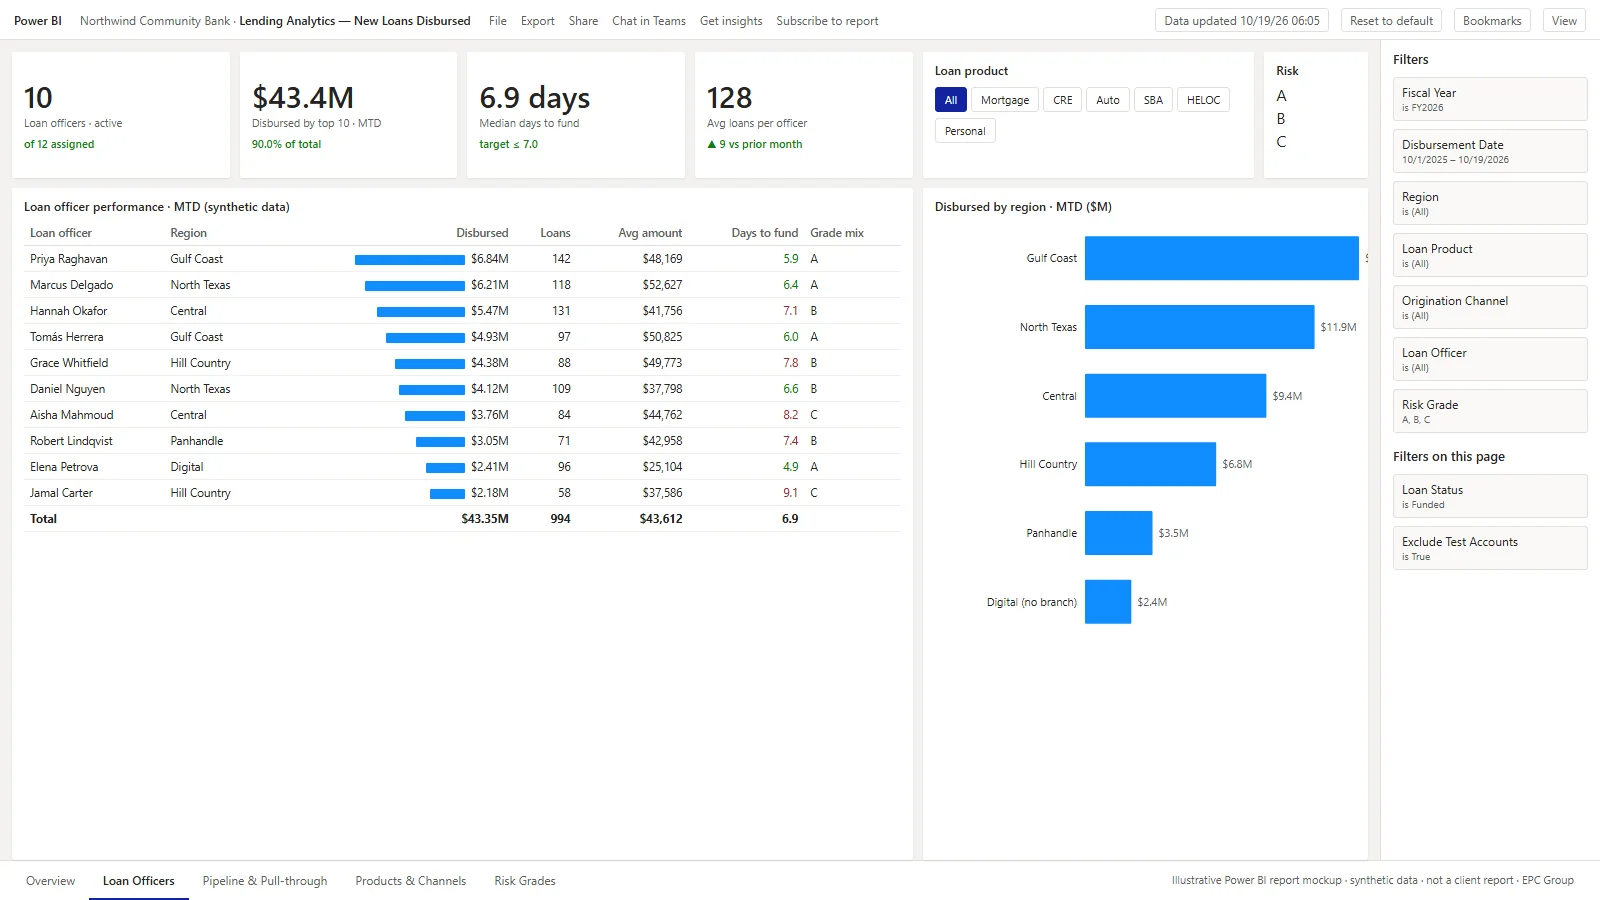
- A matrix with data bars and conditional formatting: disbursed amount, loan count, average amount, days to fund (green at or under the seven-day target, red above) and risk-grade mix per officer.
- Product and risk-grade slicers re-cut the matrix without leaving the page; the region bar chart cross-filters it.
- In production this page carries row-level security so a regional manager sees only their officers while the chief lending officer sees all of them — the same report, one semantic model.
Page 3 — Pipeline and pull-through: what is coming, and what fell out
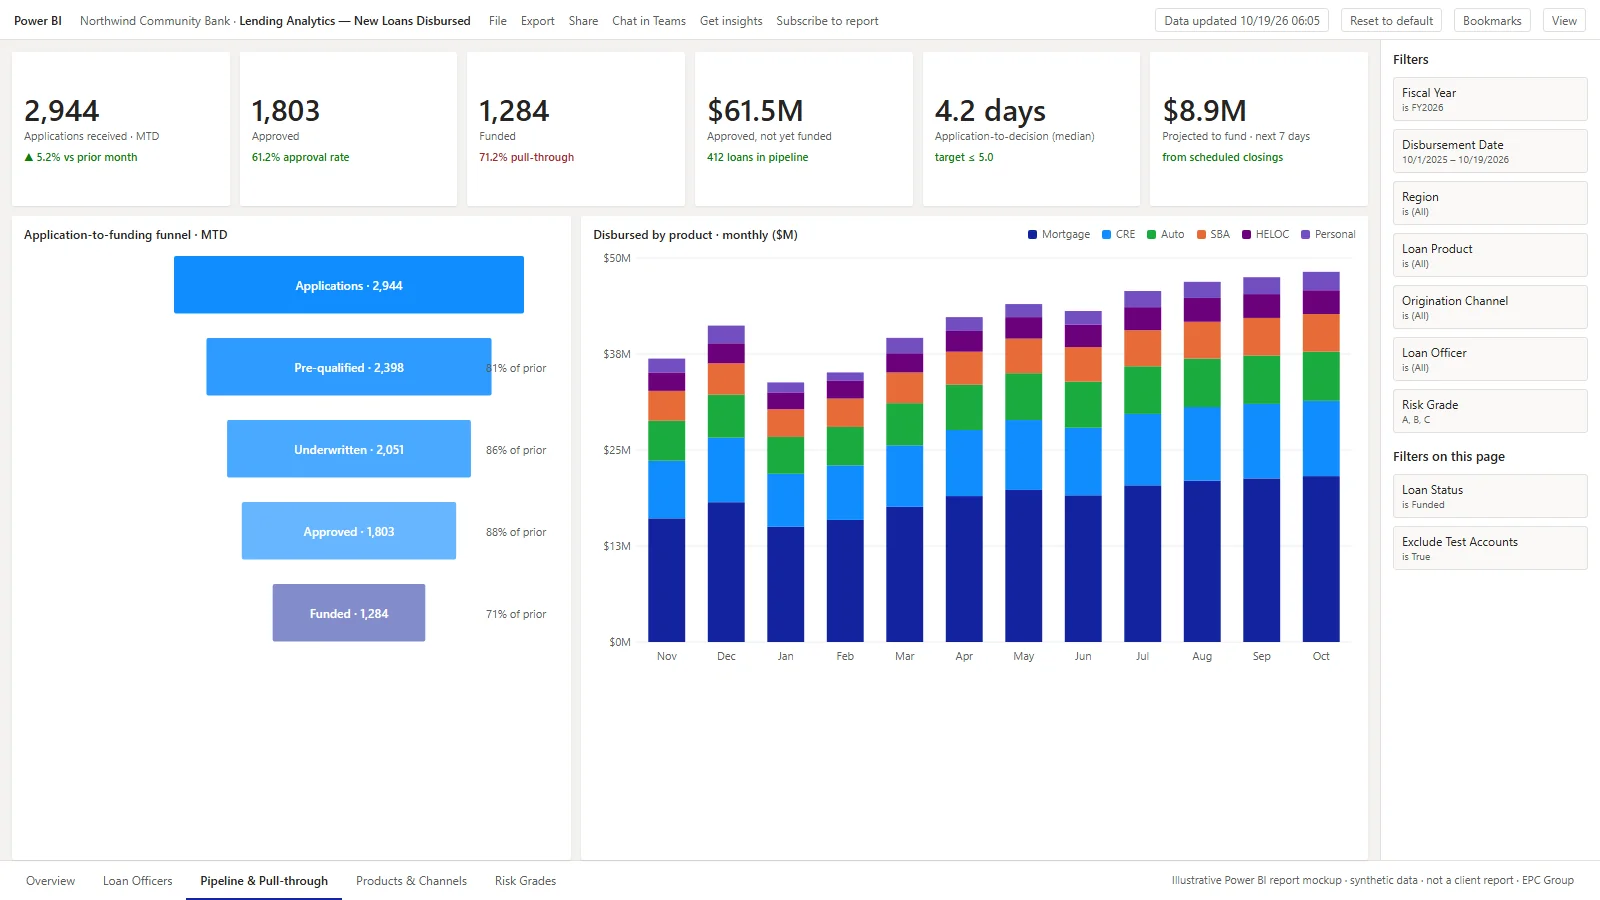
- The funnel shows each stage as a share of the prior stage, so the drop between approved and funded (pull-through) is visible without arithmetic.
- Approved, not yet funded is a dollar amount and a loan count, with the projected seven-day funding figure beside it — the number operations uses to plan closings.
- The stacked monthly column chart breaks disbursements by product so a mix shift (mortgage versus commercial real estate, for example) is seen before it shows up in the margin.
How a report like this is built
Sources
Loan origination system events (application, decision, funding), the core or servicing platform for funded balances and product codes, CRM or branch data for officer and channel attribution, and a date table.
Model
A star schema with one fact table per event grain (applications, decisions, fundings) and conformed dimensions for date, product, channel, region and officer; measures for disbursed amount, counts, medians and pull-through are DAX, not report-level calculations.
Governance
Row-level security by region and officer, sensitivity labels on the semantic model, a certified dataset so every page reconciles, and a refresh schedule tied to the origination system batch.
Related reading: financial services industry practice, financial services Power BI and the Power BI consulting service.
Frequently Asked Questions
What does the New Loans Disbursed report show?
Three report pages: an Overview with month-to-date disbursed amount, loan count, average funded amount, median approval-to-funding days, fiscal-year-to-date against target and pull-through rate, plus a 13-month trend against the prior year, disbursements by origination channel, by loan product and by region; a Loan Officers page with a conditional-formatted performance matrix and region bars; and a Pipeline page with the application-to-funding funnel and monthly disbursements stacked by product.
Is the data on these screenshots real?
No. Every figure, name and region is synthetic. The mockups are rendered from fictional data for a fictional institution, Northwind Community Bank, so the layout and measures can be shown without exposing any client. Real EPC Group lending deployments carry the same visual pattern on the client's own data.
What data sources feed a report like this?
A loan origination system (application, decision and funding events), the core banking or servicing platform (funded balances and product codes), the CRM or branch system (officer and channel attribution) and a date table. In a Fabric deployment these land in a lakehouse and the semantic model reads them in Direct Lake mode; in a Power BI Pro or Premium Per User deployment they arrive through scheduled dataflows.
How does EPC Group price a lending dashboard like this?
As a fixed fee quoted after a 30-minute scoping call. EPC Group does not publish price ranges. The scope drivers are the number of source systems, the governance model (row-level security by region or officer), the volume of measures and the training required.
Power BI Strategy: 2026 Considerations for Power BI Report Samples New Loans Disbursed
Direct Lake mode has changed the economics of enterprise Power BI in 2026: instead of importing data into Vertipaq, semantic models now query OneLake-resident Parquet files at near-Import-mode performance without the refresh-window cost. When an organization moves a model from scheduled Import-mode refresh to Direct Lake, we design for sub-second report interactions and verify them against your capacity and model; the Import data refresh is replaced by a metadata-only Direct Lake refresh called framing (Microsoft Learn, accessed 2026-10-28).
Row-level security (RLS) and object-level security (OLS) in Power BI Premium and Fabric F-SKU capacities are the single most-overlooked compliance control in HIPAA, SOC 2, and FINRA-regulated environments. Microsoft documents RLS as roles with DAX filter expressions defined in Power BI Desktop, members assigned in the Power BI service and each role checked with Test as role; RLS applies to workspace Viewers only, service principals cannot be added to an RLS role, and an embedding app that signs in with a service principal applies per-user RLS by passing an effective identity in the embed token (Microsoft Learn, accessed 2026-10-28). EPC Group tests RLS with the real effective identity of each deployment scenario, because Test as role cannot simulate embedded or B2B guest identities.
Decision factors EPC Group evaluates
- Copilot grounding quality assessment of semantic-model metadata
- Direct Lake mode adoption for Fabric-resident semantic models
- License optimization audit (Pro vs Premium Per User vs F-SKU)
- Row-level security via service principal authentication
- Capacity sizing decision (F2/F4/F64+) tied to peak concurrent users and refresh window
For a tailored read on this topic in your specific tenant, contact EPC Group at contact@epcgroup.net or +1 (888) 381-9725. See pricing and engagement models.