Power BI is a business analytics and reporting service from Microsoft that allows users to create and share dashboards and reports, which can be embedded in websites. Tableau is another business intelligence tool that has been around for a long time. It can quickly analyze large amounts of data and present it in ways that make sense for the audience you’re trying to reach.
Tableau is more for beginners who want to learn how to create visualizations using easy-to-follow tutorials. However, it is also an excellent tool for small businesses looking for a simple way to present their data engagingly. In contrast, Power BI is more advanced than Tableau and is geared towards businesses that need advanced analytics capabilities such as complex calculations or custom fields.
Power BI
Power BI is a powerful data analytics tool funded by Microsoft. It serves business intelligence features with lucid visualizations. You get this app as a cloud-based service with a desktop-style interface. Small-scale data warehouses abilities like data unearthing, data transformation, and user-friendly dashboards are core Power BI features of this tool.

Power BI Features
- Export Dashboard
- Data Modelling
- Connect to Data Source
- Custom visualization
- Natural language (Q/A)
EPCGroup Also provides Power BI Consulting for organizations who are looking to bring business intelligence into their organization. We have over 70+ in-house business intelligence experts with over 100+ years of experience. You can also check our Power BI cost.
Tableau
Tableau, on the other hand, is a specialized data visualization tool that is used for making business intelligence decisions. It can transform any unstructured raw data into a structured, understandable format with very less coding or other technical expertise. You can do visualizations either in worksheets or dashboards to provide insights and generate dashboards.

Features of Tableau
- Blending of Data
- Less Technical Knowledge required
- Fast and Real-time analysis
- Data accumulation
- DAX Query
Power BI vs Tableau: What’s the Key Difference?
Power BI and Tableau are well-known data visualization solutions for business intelligence and data analysis. Nonetheless, they have distinct priorities, strengths, and target audiences, resulting in significant contrasts. Here are a few key distinctions:
1. Target audience
Power BI targets business users, particularly those in small to medium-sized organizations, looking for a more accessible and affordable data visualization tool. Conversely, Tableau is more geared towards data analysts and data scientists who require a more robust and complex set of data visualization capabilities.
Power BI has been primarily developed as a business intelligence tool so managers and executives can see positives to visualize their company’s key performance indicators (KPIs). This allows them to understand better how their organization performs against its goals.
2. Ease of use
Power BI is more straightforward to use than Tableau, thanks to its intuitive drag-and-drop interface and more straightforward setup process. Tableau is known for its flexibility and advanced features, but it can also be more challenging for new users.
Power BI is cheaper than Tableau Desktop or Visualization — although there are a few different tiers available that can help you customize the software to your needs. On the other hand, Tableau offers free trial licenses for new users who want to test out its capabilities before committing to a longer-term commitment.
3. Data connectivity
The data connectivity feature in Power BI lets you connect to a wide range of data sources, including cloud-based and on-premise databases and other tools. Tableau offers more advanced data connectivity options and allows for more customization and flexibility when connecting to and blending data from multiple sources.
For example, if you use a cloud database like Azure or AWS for some of your business intelligence needs, you can connect it with Power BI through the Microsoft Graph API or other third-party APIs (application program interfaces).
4. Price
Power BI is more affordable, but Tableau offers more comprehensive features and powerful data visualization capabilities.
In terms of price, Power BI is cheaper than Tableau and has a much lower cost of entry. Users can start creating reports in Power BI immediately without purchasing an enterprise license. Tableau also allows users to work with multiple data sources simultaneously, while Power BI requires users to specify which data they want to use before they begin working with it. The pricing model for both products is simple.
Power BI and Tableau have advantages and disadvantages, and the user’s demands and requirements will determine the choice between the two.
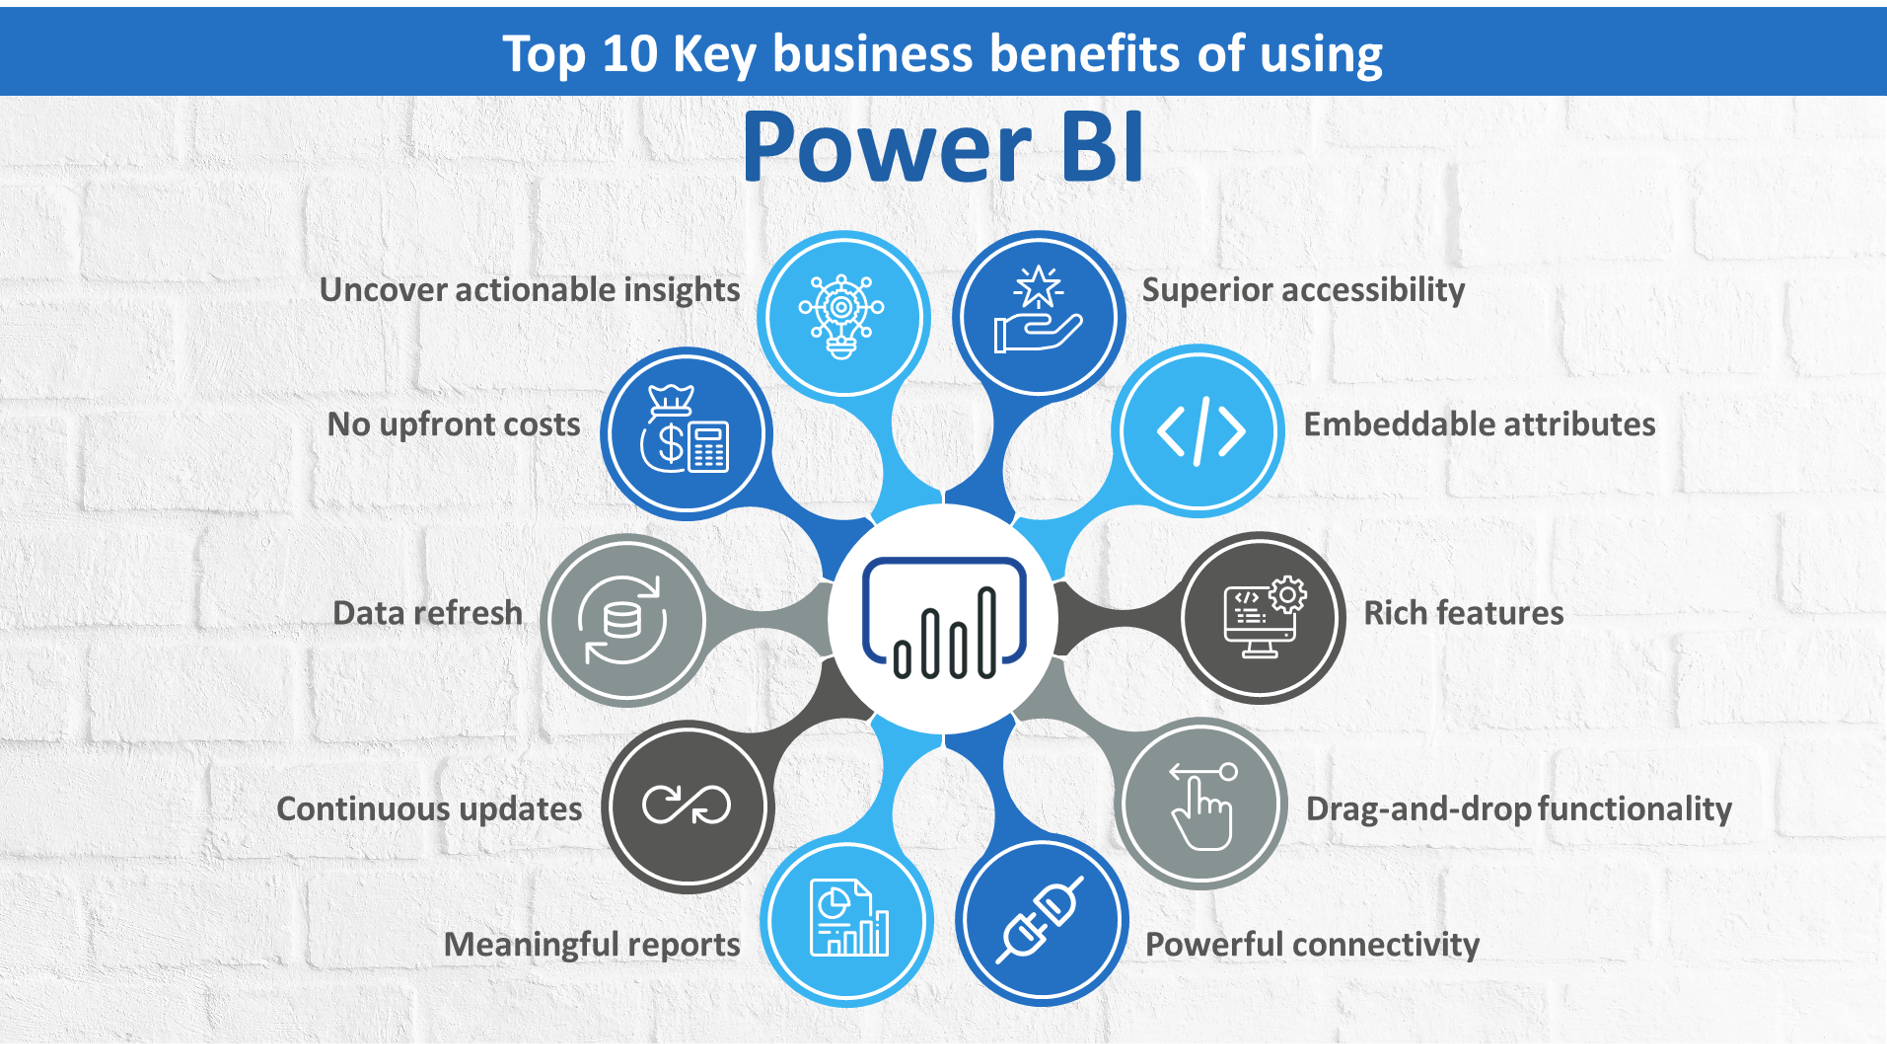
New Updates to Power BI and Tableau Analytics
Power BI and Tableau are continuously developed and often updated to give users the most up-to-date features and capabilities. The following are some of the most recent modifications to both tools:
| Power BI | Tableau |
| AI-powered insights: Power BI now includes an AI-powered Insights feature that allows users to quickly identify patterns and trends in their data by using machine learning algorithms. The new feature is designed to help you make smarter decisions faster by applying machine learning algorithms to your data. | Tableau Prep Builder: Tableau has added a new data preparation tool called Tableau Prep Builder, which allows users to clean and shape their data before creating visualizations. |
| Power BI Report Server: Power BI has released a new on-premises report server, which allows organizations to host their Power BI reports and dashboards on their servers for added security and control. | Tableau Reader: Tableau has added a free desktop application, Tableau Reader, which allows users to view and interact with Tableau visualizations without a Tableau license. |
| Power BI Paginated Reports: Power BI now includes creating paginated reports optimized for printing and rendering large amounts of data. | Tableau Online: Tableau has introduced a new cloud-based version of its platform, Tableau Online, which allows users to publish, share, and collaborate on their visualizations in the cloud. |
Overall, Power BI and Tableau are continually improving to give users the most up-to-date data visualization and analytics capabilities. The particular changes and features will depend on the version of the product the user is using and the organization’s specific needs and requirements.
Complete Cost of Ownership Comparison of Power BI vs Tableau
The cost of ownership for Power BI and Tableau can vary depending on several factors, including the size of your organization, the complexity of your data, and the specific features and capabilities you require. However, here are a few key factors to consider when comparing the cost of ownership for both tools:
#1. Licensing
The price of a data visualization product is an essential factor when choosing one. Tableau is generally more expensive, with a wide range of pricing options ranging from a few thousand dollars per year to hundreds of thousands for large enterprise deployments.
Power BI has a more straightforward pricing model, with a free version that includes basic features and paid versions that range from $9.99 to $20 per user per month. However, the most important thing to consider when deciding whether or not to pay for a data visualization product is what you’re trying to accomplish with it.
#2. Training and support
Power BI is generally considered easier to use and more accessible for non-technical users. Training and support for both tools can be provided through various channels, including online tutorials, in-person classes, and support from the vendor.
Tableau, on the other hand, requires more technical training than Power BI does. It is also easier to get information about using Tableau’s interface with consulting documentation or a trainer.
#3. Data storage and hosting
Power BI and Tableau can be deployed on-premise or in the cloud, and the cost of data storage and hosting can vary widely depending on the size and complexity of your data and the specific deployment option you choose.
In either case, you’ll need to create a plan to extract data from your organization’s systems, load it into a BI solution like Tableau or Power BI, and then analyze it.
#4. Add-ons and extensions
Both Power BI and Tableau have a variety of add-ons and extensions available that can enhance the functionality of the tools and increase the cost of ownership. For example, you can use Power BI to connect to your SQL Server database or other data sources, allowing you to extract custom reports based on your data.
It’s crucial to remember that the cost of ownership for Power BI and Tableau can vary greatly depending on your organization’s individual needs and objectives, so it’s best to undertake a complete cost-benefit analysis before selecting. However, both platforms include free trials, which may be a helpful resource for determining the total cost of ownership for your unique use case.
4 Things you must Understand about the User Interface of Power BI and Tableau
A user interface bridges the user and the information they’re looking for. It’s a combination of technology and design that allows you to move around, access, and understand your data. The following four facts about the user interface of Power BI and Tableau:
- Data visualization options
Data visualization choices in Power BI and Tableau include bar charts, line charts, scatter plots, and more. Tableau is generally considered to offer more advanced visualization options, while Power BI is designed to be more accessible for non-technical users.
Power BI’s data visualization features are built on top of the Microsoft Excel engine, meaning they have a steep learning curve. However, if you’re looking for a tool to make your data visualizations look like those in professional reports or presentations, then Power BI is worth trying.
- Customization
Power BI and Tableau offer a high degree of customization, allowing users to customize their visualizations and reports to meet their specific needs and requirements. Tableau is generally considered to offer more customization options, while Power BI is designed to be more accessible for non-technical users.
Power BI also offers more advanced features, such as its ability to connect to external data sources (such as spreadsheets or databases), whereas Tableau does not have these features available out of the box.
- Integration with other tools
Power BI can be integrated with various other tools and platforms, including data storage, business intelligence, and collaboration tools, while Tableau offers similar integration options but is generally considered more flexible in this regard.
Power BI for Excel and Power BI for SharePoint are two versions of Power BI that allow users to access their data from Excel or SharePoint using the familiar interface. This can be useful if you have complex data that you’d like to present in a spreadsheet format.
- Collaboration
Power BI and Tableau are vital tools for data visualization and analysis, but they have some fundamental differences that make them better suited to different types of users. Power BI is generally considered more accessible for non-technical users, while Tableau is designed to be more flexible and powerful.
Power BI has a heavier emphasis on business intelligence (BI). It’s designed to help users build dashboards and other reports that can be used to analyze data quickly and easily.
Power BI vs Tableau: Comparison of the Advantages and Disadvantages
Power BI and Tableau are powerful business analytics tools that allow you to analyze your data, create visualizations and dashboards, and share your insights with your team. But which one would meet your requirements the best?
We put these two tools through their paces to see which would be best for most people. Here is a comparison of the advantages and disadvantages of Power BI and Tableau:
Power BI
| Advantages | Disadvantages |
| Integration with Microsoft products: Power BI is an excellent option for businesses using Microsoft products like Excel and SharePoint because it interfaces with them. | Limited data visualization options: While Power BI is designed to be accessible for non-technical users, it has fewer data visualization options than other tools, such as Tableau. |
| Cost: Power BI has a more straightforward pricing model, with a free version that includes basic features and paid versions that range from $9.99 to $20 per user per month, making it a more cost-effective option for many organizations. | Integration limitations: Power BI is designed to integrate with other Microsoft products but may have limitations when integrating with non-Microsoft tools and platforms. |
| Cloud-based deployment: Power BI is designed to be deployed in the cloud, making it accessible from anywhere with an internet connection and reducing the need for on-premise hardware. |
Tableau
| Advantages | Disadvantages |
| Flexibility: Tableau is designed to be highly flexible, allowing users to connect to a wide range of data sources and customize their visualizations to meet their specific needs and requirements. | Limited data visualization options: While Power BI is designed to be accessible for non-technical users, it has fewer data visualization options than other tools, such as Tableau. |
| Interactive Visualizations: Tableau allows users to create interactive and dynamic visualizations that help to understand the data better and make better decisions. The visualizations can also be easily customized and shared with others. | Integration limitations: Power BI is designed to integrate with other Microsoft products but may have limitations when integrating with non-Microsoft tools and platforms. |
Conclusion
In conclusion, both Power BI and Tableau have their strengths and weaknesses in terms of the user interface, and the best choice for a specific organization will depend on the organization’s specific needs and requirements, such as the size and complexity of the data, the expertise of the users, and the desired level of customization and collaboration.
How EPC Group can Help you Use Power BI to Achieve your Business Goals
EPC Group is a leading provider of Power BI solutions and services. We have been helping companies to use Power BI to achieve their business goals for over a decade.
Our consultants are experts in Power BI, so they know how to get started quickly and easily. In addition, our solutions are designed for different types of organizations, including those who need help getting started or want to deploy their first Power BI solution.
Through boosting data exploration, our Microsoft Power BI professionals, visualization architects, and analytics engineers collaborate with you to find insights buried inside your data. Power BI allows users to consume and analyze a wide range of live data via simple dashboards, interactive reports, and appealing data visualizations.
We design Power BI solutions so that you may start generating actionable insights in a simple setup. We also assist in creating Power BI dashboards that incorporate Salesforce, Google Analytics, and Microsoft Dynamics.


