
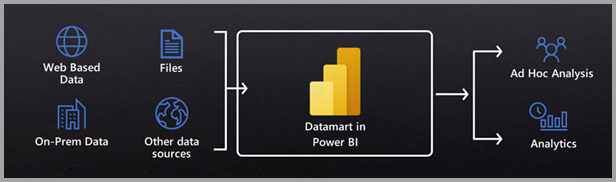
Data Marts are built on top of Microsoft’s Power BI service offering, which provides tools for building self-service applications connected to live data sources available via APIs. Datamarts enable users to build reports and visualizations without prior knowledge about IT operations or databases.
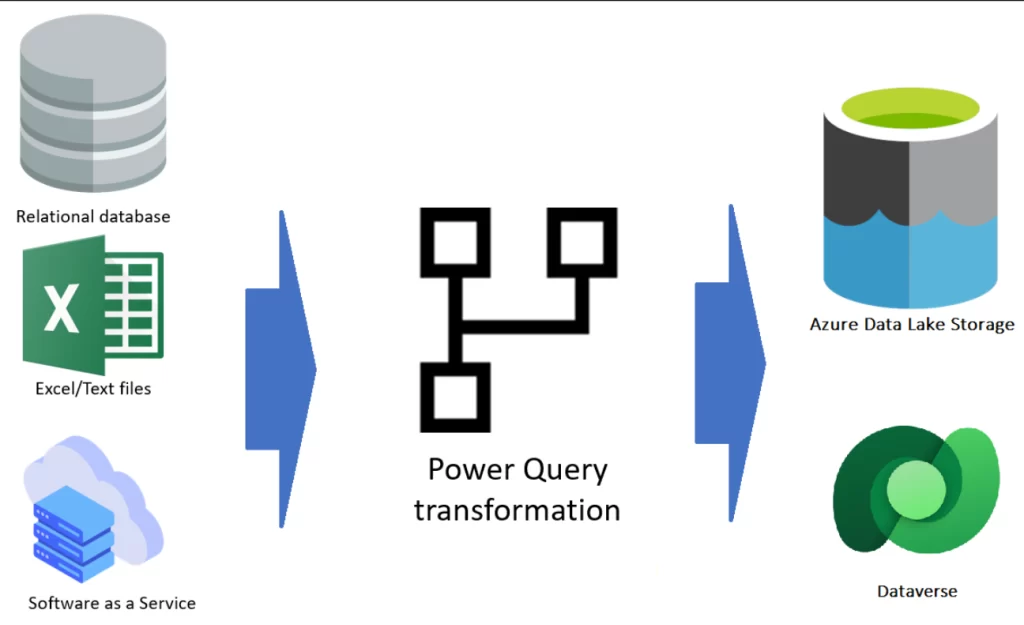
Self-service analytics tools, called data marts, let users store and analyze loaded data from fully managed databases. For example, to extract, convert, and load (ETL) data using Power Query and then insert it into an Azure SQL database that is wholly managed and doesn’t need tuning or optimization, data marts offer a direct and potentially no-code experience.
By bridging the gap between business users and IT, data marts help. For example, the Microsoft BI platform, on which Data Marts are based, enables IT to deploy updates to a specific data source without waiting for IT to finish the job.
Start Building Reports Using Power BI Desktop
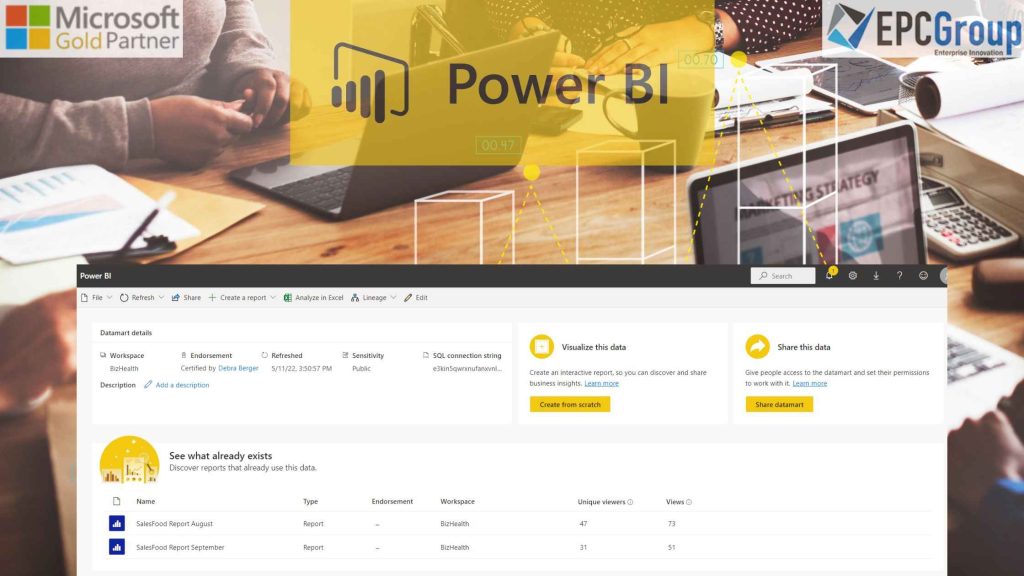
Creating reports in Power BI Desktop is a breeze. From within the datamart experience, navigate to the New report button using the ribbon and the main home tab. This offers an easy and intuitive approach to producing reports.
A new browser tab with the report editing canvas and the dataset is opened by selecting New report. If you have to write rights for the workspace in question, you will be asked to select one when you save your new report. The new report is saved in your My workspace if you don’t have write access or if the dataset is located in a workspace with a Premium capacity.
Using the workspace’s action menu and the automatically created dataset: To build a report in the Power BI service, go to the auto-generated dataset in the Power BI workspace and pick More from the menu.
Using the dataset information page that was automatically generated: To access the dataset information page and view related reports, choose the name of the auto-generated dataset from the Power BI workspace list.
4 Benefits Of Power BI Data Mart
Datamarts provide the following benefits:
- Self-service users may readily complete relational database analytics without the assistance of a database administrator.
- Data Marts offers complete SQL data intake, preparation, and exploration capabilities, including no-code user interfaces.
- Allow for creating reports and semantic models in a single integrated experience.
- Datamarts allow you to build simple reports from your data without writing any code.
Expand Your Power BI Usage with this Data Mart feature
If you want to expand your Power BI usage with a data mart feature, Datamart might be the answer.
Data Marts are a great way to expand your Power BI usage without worrying about data management’s intricacies. You can use the same data mart in Power BI, Microsoft Excel, or any other Microsoft analytics offering. In addition, data Marts are 100% web-based, so you don’t have to worry about installing software or managing a database.
Data Marts offer a no-code experience that produces a highly scalable data mart that is quick and simple. They also come with a built-in visual and SQL Query editor for ad-hoc analysis, allowing you to view visually what your data looks like and perform SQL queries on it.
Data Marts can be used with Power BI Premium capacities and Premium Per User plans, so you’ll always have space!
Why You Should Be Using Data Marts In Power BI
Data Marts are targeted toward interactive data workloads for self-service scenarios. For example, you can create your data models and collections if you work in accounting or finance. You can use them to self-serve business queries and responses using T-SQL and visual query experiences.
Additionally, you may continue to use those data sets for more conventional Power BI reporting activities. However, customers who want domain-oriented, decentralized data ownership and design, such as consumers who require information as a product or data as a self-service platform, are advised to adopt data marts.
Data Marts are designed to support the following scenarios:
- Suppose you work in accounting or finance and want to create data models and collections that you can use to create visual and T-SQL queries that you can use to self-serve business inquiries and answers. Additionally, you may continue to use those data sets for more conventional Power BI reporting activities.
- If you want domain-oriented, decentralized data ownership and design, you should invest in one, such as consumers who require information as a commercial or a self-service information platform.
- Our product is designed to give you an easy way to access the data in your relational database without worrying about managing the infrastructure or orchestrating dataflows between different datasets. You can use it as a standalone tool or integrate it into other tools that support SQL-based queries using T-SQL (the same language used by Microsoft SQL Server).
- We offer several levels of support for our customers: from basic service packages that include access to one data mart with any number of tables and columns to enterprise-level support that includes additional features like integration with T-SQL used by Azure Synapse and other applications/services.
Difference Between Dataflow And Data Marts
Dataflows and data marts are two different things. You can use dataflows to ingest data into your data marts, but you cannot use data marts to build reusable ETL logic.
- If you provide your data lake, dataflows offer reusable extract, transform, and load (ETL) capabilities that you can utilize in Power BI or CDM format. Power BI uses dataflows to load data into your data marts. Dataflows should always be used when you wish to reuse your ETL logic.
- Dataflow is designed to create reusable, shareable data prep used in Power BI. The output is always a set of items, though you can also have filtered data tables.
- Data marts are made to graphically sort, filter, and aggregate data using SQL expressions or other methods. Through a SQL endpoint, you may also provide accessible data. Results are always the output (e.g., sets, tables, and filtered data tables).
- You may store and examine your data in a relational, fully managed Azure SQL DB using Data Marts, a fully managed database. A dataset is automatically generated for each data mart, and data marts include SQL support, a no-code visual query builder, Row Level Security (RLS), and these features. Ad hoc analysis and report creation are both possible online.

Building An Architecture for Power BI Development Model For Engineers
Power BI development is a challenging journey, but it is possible to build your own Power BI model. However, as your Power BI development cycle progresses, you realize that you require something else.
Although creating everything in a Power BI file is straightforward, maintaining it may be a hassle. For example, what happens if you wish to use a table from one Power BI file in another? Also, what happens if you wish to use a measure or phrase again in a different report?
To construct the whole architecture of Power BI Development, Power BI has provided distinct components, features, and technologies, including thin reports (reports without a dataset and links live to another dataset).
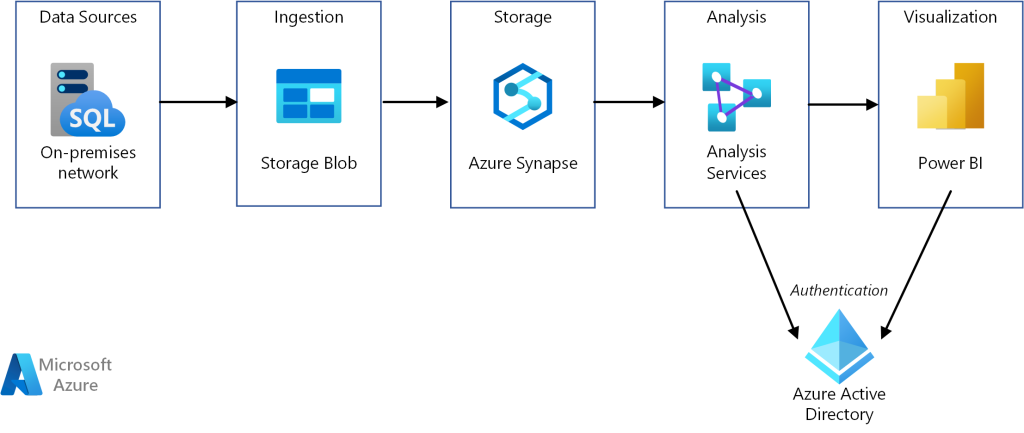
A solution’s architecture includes the relationships between its components and their physical layout. This article will describe how to create an architecture for the Power BI development model.
Power BI is a data analysis and business intelligence tool which allows users to create visual reports based on data in Microsoft SQL Server or other relational databases.
The architecture of this tool consists of four main components:
- The first component is responsible for providing all necessary services to users and their applications.
- The second component is responsible for displaying information on web pages and mobile applications. It includes an API that provides a server-side API for displaying reports on web pages and mobile applications.
- The third component is importing data from other sources into Power BI Desktop. It accomplishes this by utilizing a JSON file containing data about each item in the source system (for example, product name) and its corresponding source row identifier (for example, TestProduct).
Simplified data integration with Power BI data mart using Azure Data Factory and Azure SQL Database
If you’re a data analyst in a small to midsize company, you’ve probably been struggling with the issue of integrating your data into Power BI Desktop. You want to build dashboards and reports, but you need help. Unfortunately, your organization needs a data warehouse or a BI team to develop one. Such a thing. And that’s where Azure Data Factory and Azure SQL Database come in!
You can use Power BI Data Mart to create a regulated architecture with Dataflow (the transformation and ETL layer), Azure SQL Database (the database server or volumetric prototype), Power BI Dataset (the statistical data model), and finally, the report. These may be created utilizing the Power BI service’s user interface. He does not need to open any other tools or services except for Power BI, nor does he need to master SQL Server database architecture or any other technologies.
Get Expert Guidance On How to Grow Your Business with Power BI
Our goal in this article was to present a straightforward way for organizations to get started using Data Marts for reporting. With Power BI-related pricing up to 85% less than traditional on-premises reporting solutions, IT can allow business users to bring on new reports without investing significant time or money. In the past, they may have spent weeks or months waiting for IT to set up a data warehouse and load the necessary data before they had something to report against.
After investing in your company, it’s time to consider how to maximize its potential.
Our Power BI Managed Services experts are here to help you do just that. We collaborate with you to ensure you get the most insights and value from your business data to nurture a better understanding of your data trends. In addition, we provide ongoing, personalized support to help you optimize your business applications and drive initiatives more effectively.


