Are you searching for an easy method to get started with Power BI? If so, Power BI is considered easy to learn, especially for users familiar with data visualization and business intelligence concepts. It provides an interface with many built-in features and functions to help you create interactive dashboards and reports.
Power BI is a data analysis application that helps users make better decisions by analyzing data. It can be used in many fields, including business intelligence and analytics. Also, Power BI can create dashboards that display information from different sources.
For example, a business analyst might want to compile data from many reports into one that shows trends over time. The analyst could then use Power Bi to create a report that shows how performance has changed over a month or quarter.
What Makes Power BI Easy to Learn?
Power BI is easy to learn because it’s based on Microsoft Excel. This makes it easy for anyone to start using Power BI without experience in data analysis or reporting. Instead, the user interface of Power BI is such a way that it makes it one of the most intuitive and easy-to-use tools.
Power BI’s user interface is straightforward, especially if you’re new to data visualization. Before starting your first report, you don’t have to be a programmer or statistic specialist.
All you have to learn and practice the following points to use the entire interface:
User-friendly interface
Power BI has a modern and intuitive interface, making it easy to learn and use. Power BI is known for its user-friendly interface and intuitive design, making it a popular choice for business intelligence and data visualization.
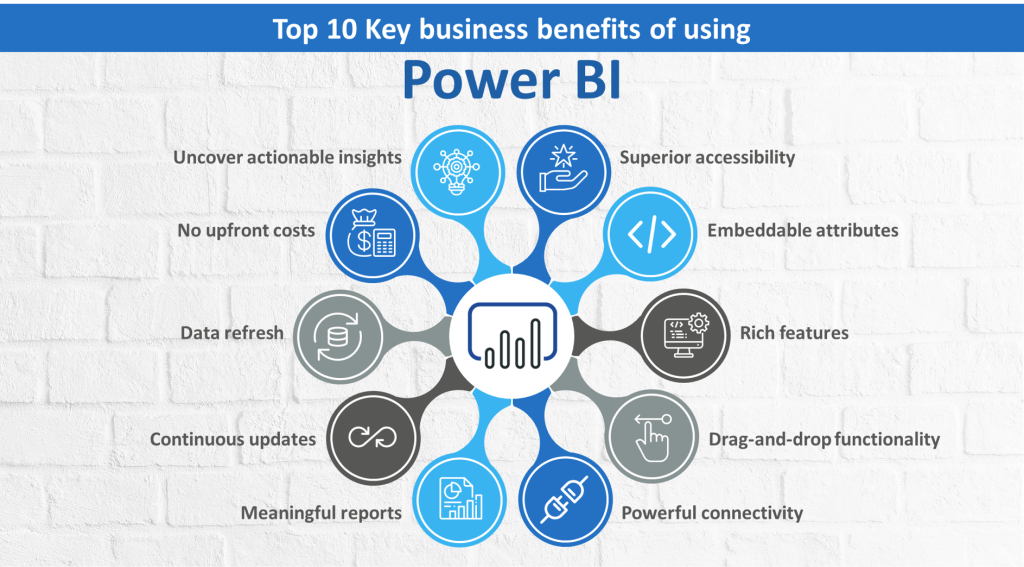
The drag-and-drop functionality and the ability to connect to various data sources make it accessible to users with varying technical backgrounds.
Also, to its user-friendly interface, Power BI offers various customization options, enabling users to create appealing and informative dashboards and reports. The platform also supports collaboration and sharing, allowing teams to collaborate on data analysis and decision-making.
Guided learning resources
Microsoft offers a range of tutorials, videos, and online forums to support learning. Microsoft Learning is the company’s online learning portal. It includes video tutorial series for most products, including Microsoft Office and the Windows operating system.
The Microsoft Learning website offers a variety of resources to help you learn. The site offers tutorials, videos, and online forums to support learning.
The videos are shorter than tutorials, but they still cover much ground. They’re perfect for an overview or learning about a particular topic. You can watch them in your browser or download them later on your device.
Integration with Microsoft tools
Power BI integrates well with Microsoft tools, particularly Excel, which makes it easier for users who are already familiar with Excel to transition to using Power BI. Also, this interface enables the easy movement of data and makes it possible to leverage the strengths of both tools.
Many of our customers use Microsoft products like Word, Excel, or Access in their business and want to better understand their data by exposing it through their existing Microsoft applications.
With Power BI, you can do much more than publish Excel reports and dashboards. You can also connect to other business systems and integrate them into your reports and dashboards.
Large community
The Power BI community is large and active, providing users with a wealth of resources and support. The community comprises individuals and organizations who use Power BI, and it provides a platform for users to share best practices, ask and answer questions, and collaborate on projects. Also, the Power BI website and various online forums can access the community.
The community has various user groups focusing on specific topics for Power BI Desktop. These user groups are open to all but are also structured to help those new to the technology find their way around the various available tools and resources.
Self-service capabilities
Power BI is designed for self-service business intelligence, allowing users to take control of their data and analysis. As a result, Power BI allows users to create and edit reports and dashboards tailored to meet their needs.
Power BI also provides free access to the BI platform through a browser-based interface, ideal for users who need to access data or report creation from remote locations. Also, the browser-based interface allows you to create mobile apps that display reports on smartphones and tablets, helping spread your data throughout the organization.
Visualization options
Visualization options in Power BI have a wide range of visualization options, from basic charts to more complex dashboards, making it easy to create impactful data displays.
You can use different graphs with Power BI, including bar, pie, column, and line graphs. You can also create stacked bars by dragging them up and down in the hierarchy pane on the screen’s right side (called a “hierarchy pane”). You can use both filter dropdowns and slicers as filters when filtering your data in Power BI reports.

6 Common Power BI Learning Challenges to Avoid
Learning Power BI is much work. It’s not about downloading the software and plugging in your data — you need to get familiar with all the different features and functionality and learn how to use them. If you’re new to Power BI, here are six common learning challenges that you may encounter while getting started:
Data visualization concepts
Power BI includes a range of data visualization capabilities that allow users to display data in various ways to communicate insights. In Power BI, users can create charts, graphs, maps, and other visualizations to help them understand their data patterns, relationships, and trends.
Data visualization is critical in communicating insights derived from data analysis. It involves representing data in a graphical format, such as charts, graphs, and maps, to help users understand patterns, relationships, and trends in the data.
DAX (Data Analysis Expressions)
DAX is a critical tool for data analysis and calculations in Power BI. Therefore, understanding its syntax and functions is crucial for working with Power BI data.
It allows you to create expressions based on columns from your table or filter them from your table based on the values you specify in those columns. You can also create calculated columns derived from other columns or tables in your report.
Limited access to support
Learning a new tool like Power BI can be challenging, especially if you need access to support from other users or experts. To avoid this, take advantage of online forums, community groups, and other resources to find answers to your questions and learn from others.
When you’re learning something new, it’s important to remember that it’s okay only to know some things right away — you don’t have to be an expert to get started using Power BI!
Data modeling
With Power BI, you can visualize your data in various ways and share them with other users. You can also use Power BI to create reports showing specific business information. The goal of data modeling is to provide a clear and understandable representation of your data so that others can use it.
To do this, you must first understand how to design a data model for your business. A good model will enable you to understand what information you need from your database, which will help you make better decisions about what should be included in your reports or analyses.
Navigation and UI
Navigating and understanding the Power BI interface and its features and capabilities can be challenging for new users. Therefore, learning about the Power BI interface and its various features and capabilities is crucial to avoid this challenge.
Additionally, you can use the online resources and communities available to Power BI users, where you may discover solutions to your problems and learn from others. Finally, navigation is one of the most important aspects of any data visualization tool. It’s not about finding your way around but also understanding how things work.
Self-service BI
The proliferation of data sources has led to complex BI solutions. Unfortunately, with so much data flowing into the enterprise, BI teams are drowning in a sea of unstructured data that cannot be understood or analyzed. And with an increasing number of users accessing their reports on mobile devices or using other non-traditional workflows, traditional BI tools are only sometimes fit for purpose.
This is where self-service Power BI comes into its own. It enables users to create and publish their visualizations without technical knowledge or support from IT departments. Instead, users add new visuals and share them with colleagues or customers.
What are Data Analysis Expressions (DAX) in Power BI?
Power BI uses the DAX formula language to perform calculations and total data. It can be challenging for some users, especially those with prior experience in formula languages or data analysis. In addition, DAX has its syntax, data types, and functions, which can make it difficult to understand at first.
Learning DAX can help you unlock the full potential of Power BI for data analysis and visualization. Here are some tips for learning DAX:
- Start with the basics: Familiarize yourself with the DAX syntax, data types, and essential functions.
- Practice, practice, practice: Use DAX formulas in your Power BI reports to apply what you have learned.
- Use online resources: There are many online resources available, including Microsoft’s DAX documentation, blogs, and tutorials, to help you learn DAX.
- Join the Power BI community: Join online forums and communities to ask questions and connect with other Power BI users who are also learning DAX.
- Get hands-on experience: Take part in data analysis and visualization projects to gain practical experience using DAX.
Remember that learning DAX requires time, effort, and dedication. It may be challenging, but with consistent practice and determination, you can become proficient in using DAX for Power BI.
Power BI: FAQ
How can I Become Proficient with Power BI?
If you have never used any BI tool before, it will take longer than a month or two to get comfortable with the platform. In this case, I recommend starting with simple visualizations such as charts and graphs before moving on to more complex analyses such as forecasting curves or running multivariate regression models. With time and dedicated effort, you’ll find that you can create more complex and insightful reports and visualizations and use Power BI to its fullest potential.
Is Power BI Cost-effective?
Power BI costs $10 per user per month on an annual subscription plan, including all the free version’s features. But, you must upgrade to a premium plan if you want to use Power BI for more than 200 users. The free version of Power BI provides access to all the essential features but does not allow users to create their reports or dashboards.
Power BI vs. Excel: Which one should you Use for Visualizing Data?
If you want to create a dashboard that shows all your key metrics, then Power BI is the best option for you. But Excel is an excellent choice if you want a more advanced dashboard that allows for extra features. For example, Power BI allows users to create custom visuals and charts using their data. But, if you’re looking for more advanced visualizations like 3D charts or maps, then Excel still has an advantage over Power BI because it comes with more features built-in from day one.
What can you Use after Learning Power BI?
After learning how to create visualizations in Power BI, you will be able to create reports based on any data source. You will also be able to share your reports with anyone who can access them.
The following are some examples of what you can do with Power BI:
- Create dashboards that display real-time information from many sources, such as SalesForce and Twitter.
- Use advanced analytics tools like machine learning and natural language processing.
- Integrate with other cloud services like Salesforce or Office 365.
How EPC Group can Help with Power BI Training
Power BI Training is an online training course designed for individuals who wish to learn how to use this software. The course will teach you everything you need to know about using Power BI Desktop for data analysis and visualization. From basic concepts such as importing data into your account and creating reports and visualizations using various charts and graphs.
Our expert team has years of expertise, and they are working with customers in both the public and private sectors, helping them to improve their business processes with Power BI. You’ll also learn how to create visualizations using conditional formatting rules so that they change based on certain conditions (e.g., if there are specific values in a column). These training classes cover everything from Power BI basics to sophisticated visualization methods. We ensure you receive enough hands-on experience analyzing data, producing interactive visualizations, sharing dashboards, and other tasks. Our customized Microsoft Power BI training includes all the knowledge required to pass the certification test.
We also provide Power BI Consulting Services. EPC Group’s Microsoft Power BI experts, visualization architects, and analytics developers will work with you to uncover insights hidden within your data by enhancing data exploration.
Fill In The Below Form For – FREE 30 Mins Power BI Consulting


