

Do you ever struggle to create a table from another in Power BI? You’re not alone. However, if you have data stored in one table and want to bring it to Power BI, you should do some data transformation.
One of the most common tasks when working with data is creating a new table based on another. Whether you need to filter, aggregate, or modify the data, Power BI offers several powerful and versatile features to help you achieve your goals.
This comprehensive guide will walk you through creating a table from another in Power BI. We’ll explore various techniques, including using Power Query, DAX expressions, and the built-in modeling tools to achieve your desired results. By the end of this tutorial, you’ll be well-equipped to handle even the most complex data manipulation tasks in Power BI. So, let’s dive in and start transforming your data!
Why Does One Need To Create A Table From Another Table In Power BI?
Creating a table from another table in Power BI is a common task for several purposes. One of the primary reasons for doing so is to transform or reshape the data to suit specific reporting or analysis requirements.
For example, you may aggregate the data to a different level of granularity, filter out unwanted rows or columns, or merge multiple tables into a single table for analysis. Creating a new table from an existing table allows you to perform these transformations without affecting the original data source.
To perform data manipulations and transformations in Power BI, one can utilize DAX or Data Analysis Expressions, included in the software package. DAX is a robust library of functions and operators that allows users to create formulas and expressions to manipulate data columns flexibly and effectively.
DAX, short for Data Analysis Expressions, is a built-in library of functions and operators that you can use to create formulas and expressions in Power BI. Of course, you can also use these same expressions in other data analysis tools, such as Excel’s Power Pivot and Analysis Services. With DAX, users can perform complex data transformations and calculations, making it a powerful tool for data analysis and reporting.
How To Create A Table From Another Table In Power BI
In Power BI, you can create a new table based on an existing table using various methods. Here are three different methods to achieve this:
Method One: DAX (Data Analysis Expressions)
DAX is a powerful language used in Power BI for creating calculated columns, measures, and tables. For example, to create a new table from an existing table using DAX, follow these steps:
1. In the Power BI Desktop, navigate to the “Home” tab, and click “New Table.”
2. Write a DAX expression using the EVALUATE or SUMMARIZE functions. For example, to create a new table based on the existing table “Sales,” you can use the following DAX expression:
NewTable = EVALUATE(Sales)
3. Or, to create a table with specific columns:
NewTable = SUMMARIZE(Sales, Sales[Region], Sales[Product], Sales[Revenue])
Method Two: Query Editor (Power Query)
Power Query is a powerful data transformation tool in Power BI, allowing you to manipulate and shape data before it’s loaded into the data model. For example, you can create a new table based on an existing table using these steps:
1. Go to the “Home” tab in Power BI Desktop and click “Transform Data” to open the Query Editor.
2. Right-click the existing table in the “Queries” pane on the left side, and choose “Reference” or “Duplicate.”

3. Make any required transformations, such as filtering, renaming, or adding new columns.
4. Click “Close & Apply” to apply the changes and load the new table into the data model.
Method Three: Using Append Queries
Append Queries allow you to combine data from tables with similar structures into a single table. For example, to create a new table by appending data from another table, follow these steps:
1. In Power BI Desktop, open the Query Editor by clicking “Transform Data” from the “Home” tab.
2. In the “Queries” pane on the left side, right-click the existing table and choose “Reference.”
3. Right-click the new query and choose “Append Queries” from the context menu.
4. In the “Append Queries” window, choose the tables you want to append and click “OK.”

5. Make any required transformations to the new table.
6. Click “Close & Apply” to apply the changes and load the new table into the data model.
7. These are three different methods to create a table from another in Power BI.
Each method has advantages and use cases, depending on the required data and transformations.
Create a Table from Another Table in Power BI | Use Cases
In Power BI, creating a table from another table is a common requirement when you need to reshape, transform, or summarize your data for a specific analysis. This process allows you to maintain the integrity of your original data while deriving new insights, creating custom calculations, or aggregating information from different tables. Power BI provides various tools and techniques, such as:
Create a Table from Another Table using DAX in Power BI.
In Power BI, you can create a new table with two columns from an existing table by using the DAX (Data Analysis Expressions) language. Here’s a step-by-step guide on how to do this:
1. Open Power BI Desktop and load your data source. Make sure the existing table you want to reference is loaded.
2. Go to the ‘Data’ view by clicking the ‘Data’ icon on the left pane.
3. Click on the ‘Modeling’ tab in the top menu.
4. Click on the ‘New Table’ button. A new formula bar will appear for you to enter a DAX expression.
5. Write a DAX expression to create a new table with the two columns from the existing table. For example, let’s assume you want to create a new table called ‘NewTable’ with the columns ‘Column1’ and ‘Column2’ from the existing table ‘ExistingTable.’ Then, use the following DAX expression:
NewTable = SELECTCOLUMNS(ExistingTable, “Column1”, ExistingTable[Column1], “Column2”, ExistingTable[Column2])
6. Press ‘Enter’ to create the new table.
7. The new table ‘NewTable’ with the columns ‘Column1’ and ‘Column2’ from the existing table ‘ExistingTable’ will now be available in your Power BI data model.
Remember to replace ‘ExistingTable,’ ‘NewTable,’ ‘Column1’, and ‘Column2’ with the actual names of your tables and columns.
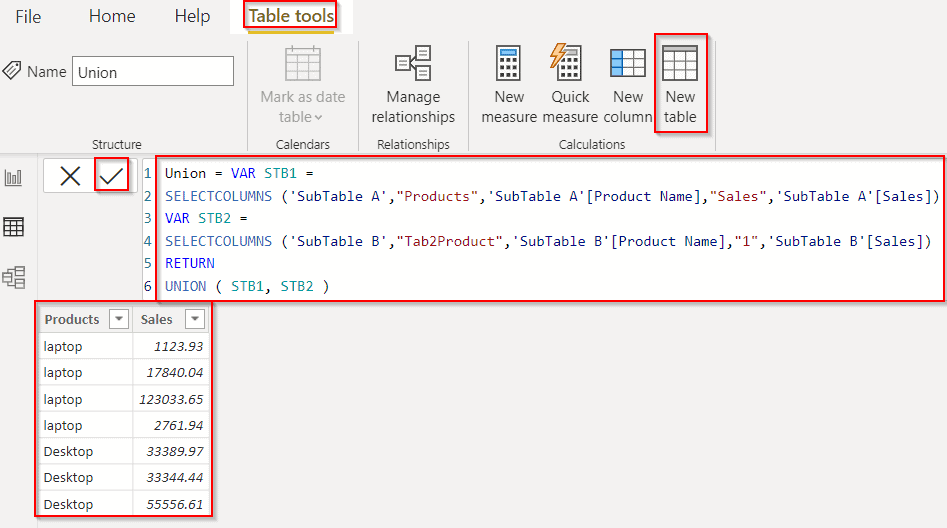
Create a Table in Power BI from another Power Query
To create a table in Power BI from another Power Query, follow these steps:
1. Open Power BI Desktop and make sure your data source is loaded.
2. Go to the ‘Home’ tab in the top menu.
3. Click the ‘Transform Data’ button to open the Power Query Editor.
4. In the Power Query Editor, locate the query you want to reference in the ‘Queries’ pane on the left.

5. Right-click on the query you want to reference, then click ‘Reference.’ This will create a new query that references the original query.
6. (Optional) If you want to apply transformations to the new query, you can use the available options in the Power Query Editor. For example, you can filter rows, remove columns, or change data types.
7. Once you have made any desired changes to the new query, click ‘Close & Apply’ in the top-left corner of the Power Query Editor. This will load the new query into your Power BI data model as a separate table.
8. In Power BI’s ‘Data’ view, you will see the new table based on the referenced Power Query.
By following these steps, you have successfully created a new table in Power BI from another Power Query. This new table will reflect any changes to the original query, ensuring that your data stays current.
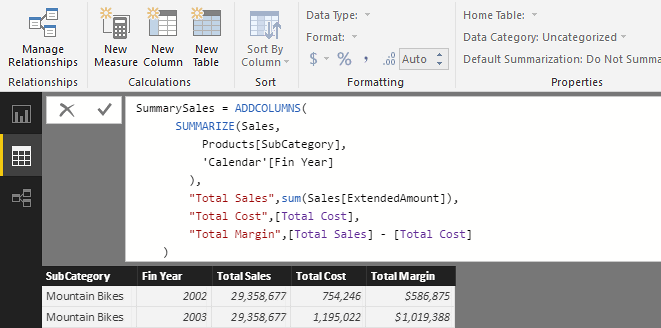
Create a table from another table to summarize in Power BI
In Power BI, you can create a summarized table from another table using the Power Query Editor. Here’s a step-by-step guide for the method:
Method: Using Power Query Editor
1. Open Power BI Desktop and ensure your data source is loaded.
2. Go to the ‘Home’ tab in the top menu.
3. Click on ‘Transform Data’ to open the Power Query Editor.
4. Locate the query you want to reference in the ‘Queries’ pane on the left side.
5. Right-click the query, then click ‘Reference’ to create a new query based on the original.

6. To summarize the table, click the ‘Group By’ button in the Power Query Editor’s Home tab. This will open the ‘Group By’ window.
7. Configure the ‘Group By’ settings according to your needs:
- Select the column(s) you want to group by.
- Choose the aggregation function (e.g., Sum, Count, Average) and select the column to apply it to.
- Provide a name for the new summarized column.
8. Click ‘OK’ to apply the summarization.
9. Once you’ve made your desired changes to the new query, click ‘Close & Apply’ in the top-left corner to load the summarized table into your Power BI data model.
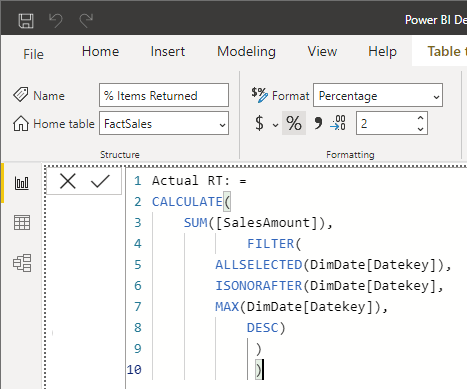
Create a Calculated table from another table in Power BI
To create a calculated table in Power BI, you can use DAX (Data Analysis Expressions), a formula language used in Power BI.
Here are the steps to create a calculated table from another table:
1. Go to the “Modeling” tab in the Power BI Desktop ribbon and select “New Table.”
2. In the formula bar, enter a DAX expression to define the calculation for the new table. For example, if you want to create a calculated table that contains a filtered version of an existing table, you can use the following DAX expression:
CalculatedTable = FILTER(OriginalTable, OriginalTable[ColumnName] = “ValueToFilterFor”)
3. Press Enter to create the calculated table. The new table will appear in the Fields pane; you can use it just like any other table in your report.
Note: Depending on your requirements, the DAX expression used in the calculated table can be as straightforward or complex as needed. You can use DAX functions, operators, and other expressions to create calculated columns, calculated tables, and measurements. Once the calculated table is created, you can use it in your report visuals like any other table.
Create A Table From A Table Without Duplicates in Power BI
You can use the Power Query Editor to create a table from another table without duplicates in Power BI. Follow these steps:
1. Open Power BI Desktop and make sure your data source is loaded.
2. Go to the ‘Home’ tab in the top menu.
3. Click on ‘Transform Data’ to open the Power Query Editor.
4. Locate the query you want to reference in the ‘Queries’ pane on the left side.
5. Right-click the query, then click ‘Reference’ to create a new query based on the original.

6. To remove duplicates, select the columns you want to use for identifying duplicate rows. You can select multiple columns by holding the ‘Ctrl’ key while clicking on each column header.
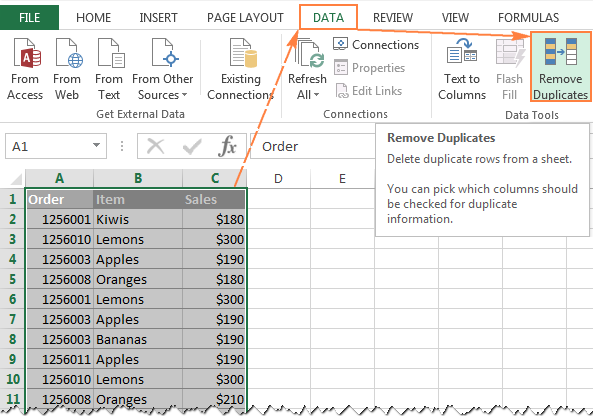
7. Once you have selected the columns, right-click on any column headers, then click ‘Remove Duplicates.’ This will remove any duplicate rows based on the selected columns.
8. After removing duplicates, click ‘Close & Apply’ in the top-left corner to load the new table without duplicates into your Power BI data model.
Now, you will have a new table in Power BI based on the original table but without any duplicate rows.
EPC Group’s Power BI Training: Transform Your Data Analysis and Visualization Skills
We are a well-established technology consulting firm that specializes in offering services related to Microsoft technologies, including Power BI. As a trusted partner, we can provide comprehensive support for Power BI, ensuring you and your team can maximize the potential of this powerful analytics tool.
We understand that each organization has unique requirements. We also offer customized training solutions tailored to your needs, enabling you to extract valuable insights from your data and confidently make data-driven decisions.
Our training programs cover various aspects of Power BI, including creating tables and other visualizations to display your data effectively. By participating in our courses, you can acquire the knowledge and skills needed to design and present tables in a user-friendly manner.


