
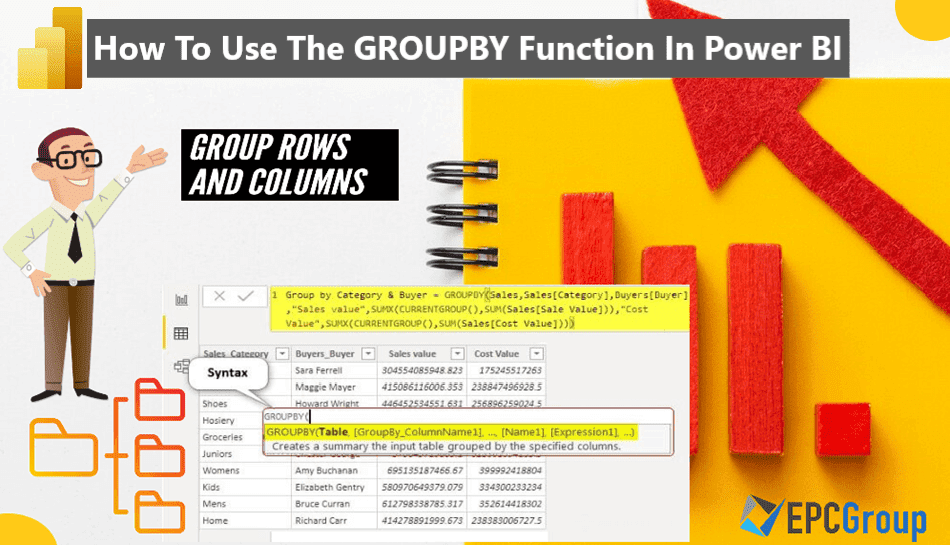
Power BI, Microsoft’s interactive data visualization tool, offers a plethora of features to transform, analyze, and visualize data in meaningful ways. One such powerful feature is the “GroupBy” function, which allows users to group data based on one or more columns, enabling the aggregation of information for more insightful analysis.
In this article, we will explore how to use the GroupBy function in Power BI, illustrating the steps with examples to ensure you can apply this feature confidently to your own datasets. Whether you’re a beginner or an experienced user, mastering GroupBy will undoubtedly add value to your Power BI skillset.
Understanding the Power BI GroupBy Syntax
The syntax for GroupBy involves specifying the columns you wish to group by and defining the aggregations to be applied.
The basic syntax is: GroupBy (Table as table, GroupedColumns as list, AggregatedColumns as list, …)
- Table: The table you want to apply the GroupBy function to.
- GroupedColumns: A list of columns you want to group the data by.
- AggregatedColumns: A list of tables defining the aggregations to apply, with each table containing a name for the new column and an expression to calculate its value.
Understanding this syntax is crucial for efficiently utilizing the GroupBy function and unlocking its full potential in data analysis within Power BI.
Benefits of Using Power BI GroupBy
By grouping data based on specific criteria, users can gain deeper insights and streamline their reporting processes.
- Data Simplification: GroupBy condenses large datasets into more manageable summaries, making it easier to analyze and understand key trends and patterns.
- Enhanced Performance: By aggregating data, GroupBy can significantly improve the performance of your Power BI reports, especially when dealing with large volumes of data.
- Facilitates Comparisons: Grouping data by specific categories enables straightforward comparisons across different groups or over time, aiding in more effective decision-making.
- Supports Complex Aggregations: Power BI’s GroupBy function allows for a variety of aggregation operations, including sum, average, count, min, max, and more, providing flexibility in data analysis.
How do I use the GroupBy feature to summarize data in Power BI?
In Power BI, the GroupBy feature is a powerful tool for data summarization. By following a few simple steps, you can efficiently aggregate and analyze your data, gaining valuable insights.
Step 1: Select the columns to be aggregated
- Load Your Data: Start Power BI Desktop, and load the dataset you want to analyze. You can do this by navigating to the “Home” tab and clicking on “Get Data.” Choose the appropriate source of your data and follow the prompts to load it into Power BI.
- Navigate to Power Query Editor: Once your data is loaded, go to the “Home” tab and select “Transform data.” This will open the Power Query Editor.
- Choose the Table: In the Power Query Editor, you will see a list of queries on the left side. Select the query (table) that contains the data you want to group and summarize.
- Identify the Columns: Look through the table and identify:
- The columns you want to group by (e.g., categories, regions, dates). These are typically columns with categorical data.
- The columns you want to aggregate (e.g., sales, quantities). These are usually columns with numerical data.
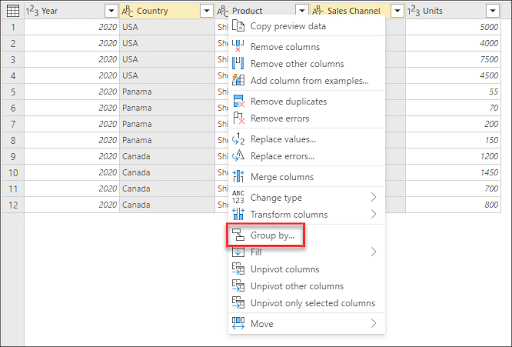
- Select the Columns: Click on the first column you want to group by while holding down the “Ctrl” key (or “Cmd” key on Mac), and select the other columns you identified in the previous step.
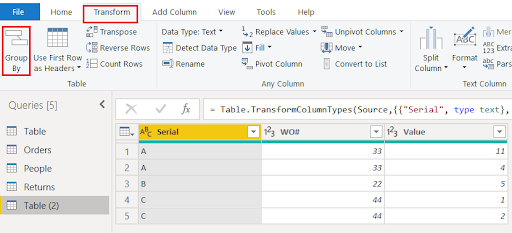
Step 2: Specify Aggregate Functions in PowerBI groupby
- Access Group By Feature: With your columns selected, right-click on one of the highlighted columns or navigate to the “Transform” tab. From there, click on the “Group By” option. This will open the Group By dialog box.
- Define Group By Columns:
- In the “Group By” window, you will see a section named ‘Group By’.
- Here, specify the columns you want to group your data by. These are the categorical columns you identified earlier. You can add multiple columns for grouping by clicking on “Add grouping.”
- Choose Aggregate Functions:
- Below the ‘Group By’ section, you will see the ‘New column name’ field and the ‘Operation’ dropdown.
- In the ‘New column name’ field, enter a name for the new column that will store the aggregated result.
- In the ‘Operation’ dropdown, select the aggregate function you want to apply (e.g., Sum, Average, Count Rows, Min, Max, etc.).
- In the ‘Column’ dropdown, select the numerical column you want to perform the aggregation on.
- Add Additional Aggregations (Optional):
- If you want to apply more than one aggregate function, click on “Add aggregation.”
- Repeat the process of naming the new column and selecting the operation and column to aggregate.
- Preview and Apply:
- As you configure the aggregations, you can preview the results in the dialog box to ensure everything is set up correctly.
- Once satisfied, click “OK” to apply the Group By operation.
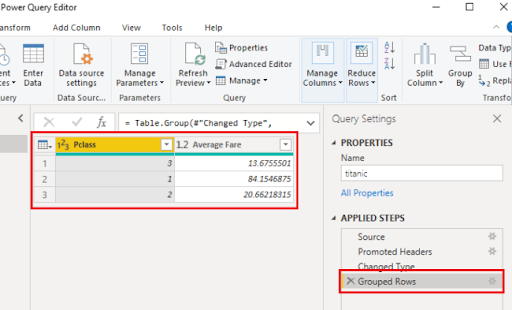
- Check the Result:
- The Power Query Editor will now display the grouped and aggregated data based on your specifications.
- Ensure the results align with your expectations.
Step 3: Add Extension Columns for Calculations
- Navigate to Add Column: In the Power Query Editor, go to the “Add Column” tab to start creating new columns based on calculations.
- Use Custom Column for Complex Calculations:
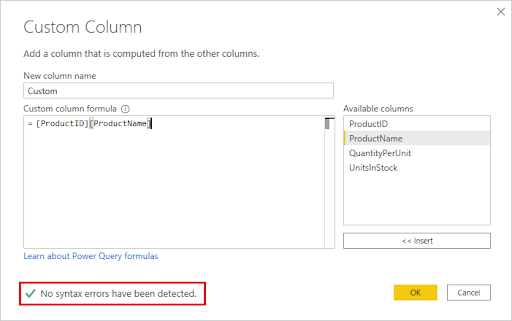
- Select “Custom Column” from the options available.
- In the “Add Custom Column” dialog box, provide a name for your new column.
- Enter the formula for the calculation you want to perform using the aggregated data. You can reference existing columns in your dataset for these calculations.
- Click “OK” to add the new column to your dataset.
- Utilize Standard Transformations for Basic Calculations:
- For simpler calculations, you might not need to create a custom column. Instead, you can use standard transformations available in the “Add Column” tab, such as “Addition,” “Subtraction,” “Multiplication,” etc.
- Select the appropriate operation, and apply it to your aggregated columns as needed.
- Perform Row-Wise Operations if Necessary:
- If you need to perform calculations across rows, you can use the “Standard” dropdown in the “Add Column” tab to select “Each Row.”
- This will allow you to apply calculations across each row of your dataset based on the values in your aggregated columns.
- Preview and Validate Your Calculations:
- As you add and configure your extension columns, preview the results in the Power Query Editor to ensure your calculations are correct.
- Validate that the new columns are providing the expected results based on your aggregated data.
- Apply Changes:
- Once you are satisfied with your calculations and the new columns, click “Close & Apply” in the “Home” tab to apply your changes and close the Power Query Editor.
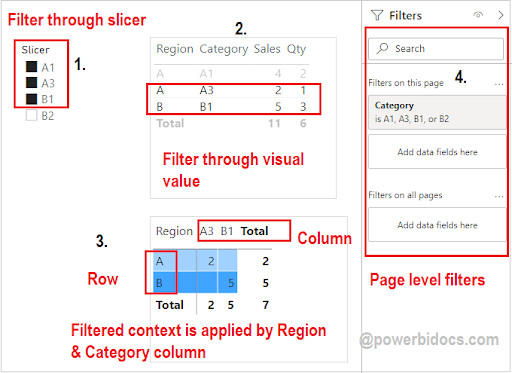
Step 4: Filter Context in PowerBI groupby
- Create Visualizations: Once you have grouped and aggregated your data, create visualizations in Power BI Desktop. Drag the fields with the grouped and aggregated data onto your canvas and select the appropriate visualization type.
- Apply Filters:
- Use slicers, visual-level filters, page-level filters, or report-level filters to apply filters to your data.
- As you apply these filters, pay attention to how they impact the grouped and aggregated data in your visualizations.
- Understand Filter Context:
- Filter context directly affects the results of your GroupBy operations.
- When a filter is applied, Power BI first filters the data and then applies the GroupBy operation on the filtered dataset.
- This means that the aggregations and groupings you see are specific to the current filter context.
- Utilize Filter Functions for Advanced Control:
- For more control over how filters are applied, you can use DAX (Data Analysis Expressions) functions like ALL(), ALLEXCEPT(), and VALUES() to manipulate the filter context.
- These functions allow you to clear or preserve certain filters, giving you fine-tuned control over the aggregation results.
- Validate Results:
- After applying filters and potentially using DAX functions to adjust the filter context, validate that the results in your visualizations align with your expectations.
- Ensure that the groupings and aggregations respond correctly to the applied filters.
- Optimize for Performance:
- Be mindful that complex filter contexts and extensive use of DAX functions to manipulate filters can impact report performance.
- Optimize your data model and DAX calculations to ensure your Power BI reports remain fast and responsive.
Step 5: Add Additional Columns with Calculated Values Using PowerBI groupby
- Create Calculated Columns:
- Go back to Power BI Desktop and navigate to the “Modeling” tab.
- Select “New Column” to create a calculated column.
- In the formula bar that appears, enter a DAX formula to calculate the values you need, referencing the aggregated and grouped columns as necessary.
- Press Enter to create the column. The calculated values will now be added to your data model and can be used in your reports.
- Use Aggregation Functions in DAX:
- When creating your calculated column, you can use DAX aggregation functions like SUMX(), AVERAGEX(), MINX(), and MAXX() to perform row context operations on your grouped data.
- These functions allow you to perform aggregations across related tables or perform calculations across all the rows in a table.
- Create Measures for Aggregate Calculations:
- If you want to create calculations that aggregate values at a higher level, consider creating a measure instead of a calculated column.
- Measures perform calculations on the fly and are not stored in the data model, making them more performance-efficient for aggregate calculations.
- To create a measure, go to the “Modeling” tab and select “New Measure.” Enter your DAX formula for the aggregate calculation.
- Use Measures in Visualizations:
- Once you have created measures, you can use them in your visualizations alongside the grouped and aggregated data.
- Measures will respect the filter context of your visualizations, providing dynamic calculations based on the applied filters.
- Validate and Optimize:
- After adding additional columns and measures, validate that the calculated values are correct and that they behave as expected in response to filters and slicers.
- Optimize your DAX formulas and data model to ensure good performance, especially if dealing with large datasets.
How to Create Stunning Data Visualizations Tables with Power BI Groupby
Creating stunning data visualizations and tables in Power BI using the GroupBy feature is a powerful way to analyze and present your data effectively.
Creating a Table Visualization with a Calculated Table in PowerBI groupby
Learn how to create compelling table visualizations in Power BI by utilizing the GroupBy feature with calculated tables, enabling you to effectively organize and analyze your data for insightful reporting.
| Step | Description |
| 1 | Open Power BI and load your data source. |
| 2 | Create a new calculated table or measure as needed. |
| 3 | In the Fields pane, select the relevant fields. |
| 4 | Drag the “GroupBy” field to the Values area. |
| 5 | Customize your table: format, columns, and style. |
| 6 | Apply filters or slicers for interactive insights. |
| 7 | Add additional visualizations for context. |
| 8 | Save and publish your report for sharing. |
| 9 | Continuously refine and update your visuals. |
Creating Virtual Tables with Implicit Calculation in the Dialog Box of a Table Visualization
This technique will empower you to present and analyze your data with precision and impact.
| Step | Action |
| 1 | Open Power BI Desktop: Launch Power BI Desktop. |
| 2 | Connect to Data: Get data from your source. |
| 3 | Data Modeling: Ensure proper table relationships. |
| 4 | Data Transformation (Optional): Clean and shape data if needed. |
| 5 | Create Table Visualization: Add a table visual to the report canvas. |
| 6 | Select Fields: Drag desired fields into the “Values” section. |
| 7 | Group By Data: Click the “Group By” icon in the “Values” section. |
| 8 | Configure Grouping: In the “Group By” dialog, choose grouping field and aggregate functions. |
| 9 | Add Implicit Calculations: Use “New Column” to create implicit calculations using DAX expressions. |
| 10 | Apply and Close: Click “OK” to apply grouping and calculations. |
| 11 | Format and Enhance: Customize the table’s appearance, headers, and style. |
| 12 | Interactivity (Optional): Add slicers, filters, or drill-through options. |
| 13 | Save and Publish: Save and publish the report to Power BI Service if necessary. |
| 14 | Refresh Data: Ensure regular data refresh to keep visualizations up-to-date. |
| 15 | Review and Share: Review and share the stunning table visualization with stakeholders. |
Take Your Data Analysis to the Next Level with EPC Group’s Power BI Predictive Analytics Services
In an era where data is a strategic asset, our services harness the full potential of Power BI’s capabilities to provide you with predictive analytics that drive smarter decision-making. Whether you’re looking to uncover hidden trends, forecast future outcomes, or optimize operations, our team of experts is here to empower you.
We work closely with your organization to understand your unique needs and goals, tailoring predictive models to deliver actionable insights. Whether it’s predictive maintenance, sales forecasting, or customer churn analysis, our services enable you to anticipate trends and make proactive, data-driven choices.
Ready to unlock the future with data? Contact EPC Group today and supercharge your analytics with Power BI Predictive Analytics Services. Elevate your insights, make smarter decisions.


