
Tenant-level analytics allows administrators to view and compare insights derived from the Platform telemetry data across environments they manage. It allows admins to view reports having analytics that apply to all domains within the tenant.
When activated, this function will copy information from environments associated with a tenant to the tenet location geo regardless of the location of the domain. A tenant administrator role is needed for the one-time procedure for obtaining permission for tenant-level analytics.
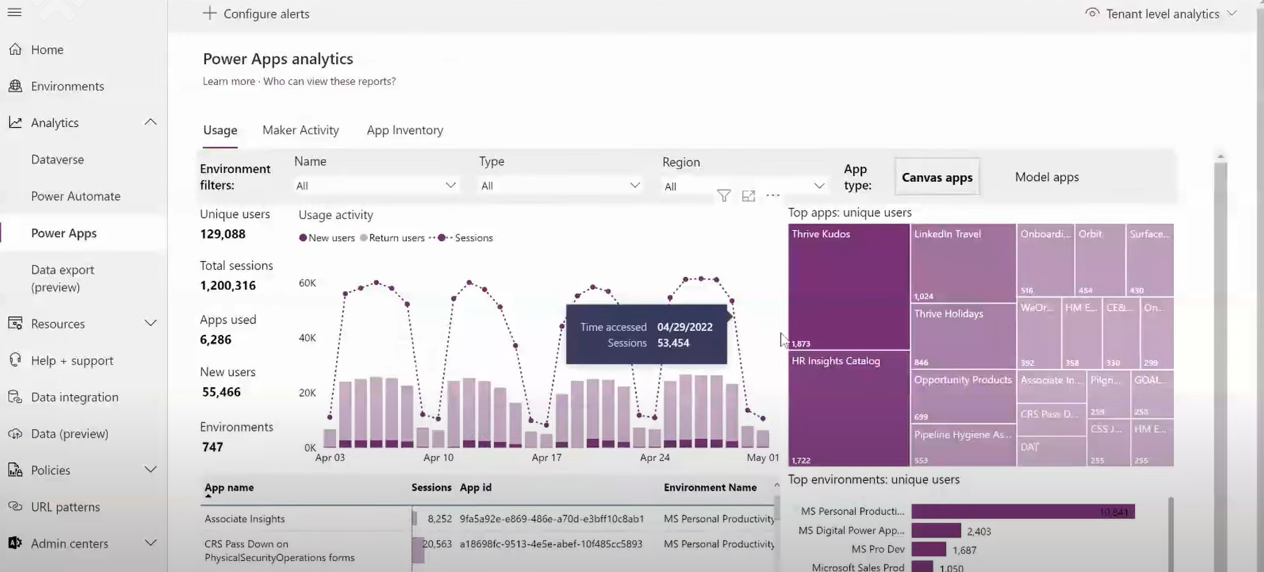
Log in to the Power Platform admin portal and choose Analytics > Power Apps to get these reports. In the upper-right corner of the page, select Tenant level analytics from the dropdown list.
How to enable the tenant-level analytics preview feature
To enable the analytics preview feature, you must have the following three roles:
- Global administrator
- Service administrator
- Delegated admin
These actions are not possible for environment administrators. The administrator does not have to be a licensed user.
- To enable the analytics preview feature, follow these steps: Select the Gear icon (Gear icon.) in the upper-right corner of the Microsoft Power Platform site and select Power Platform settings.
- Select the choice to Enable tenant-level analytics.
- Copying service telemetry data from various GEO sites into a convenient place for reporting is part of the information gathering process for tenant-level analytics. Customers must expressly enable this Power Platform function.
- To give the service permission to store service telemetry data at the location associated with the default environment, choose Enable.
- Choose Save to activate the tenant-level analytics preview function and exit the form.
- To move between viewing modes, choose Environment level analytics and then select Tenant level analytics.
- The tenant-level analytics preview will appear in the top right corner of the screen.
Microsoft PowerApps Tenant-level Analytics
Power Platform admins can now extract data based on user adoption across their environments. The new tenant-level analytics feature is vital to the Power Platform’s expansion into the cloud.
This feature enables users to extract key service metrics based on user adoption across the environments they manage. Tailor-made reports are contained within the Power Platform Admin center so administrators can view and analyze these metrics quickly.
How the Power App Usage Report Can Help You Understand Your Users
The Power App Usage Report is a helpful tool for figuring out how your users are using your app. The report includes information about what users do and don’t use, where they get stuck and how long it takes them to complete tasks. The report also has information about what features, and functionalities are often used, which can help you plan for future updates.
You can create reports for each of your apps or one account per user and then export that data into other words or spreadsheets. To find the information you want, you may also change the filters.
Maker Revenue and Activity Report
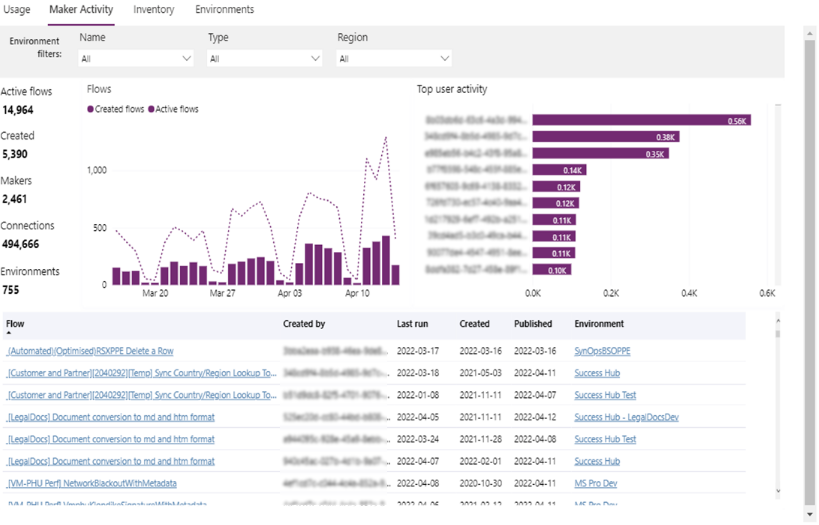
This report shows how many attempts were made by maker activities, who performed them and how much time was spent on each activity. The report also shows the revenue generated by your Maker activities, so you can see if that increased revenue translates into more Maker activity or lower costs for your company.
The Inventory Report in PowerApps
The Inventory Report is an essential part of your PowerApps analytics and reporting. It supplies a unified view of all the data and information you want to know about your business’s inventory.
This report allows you to:
- View items in stock and in order, as well as their status.
- Keep track of out-of-stock products that have been ordered.
- Use filters to narrow down your results.
Microsoft Power Automate Tenant-level Analytics
It is a powerful tool in Power Automate’s arsenal. They allow administrators to extract key service metrics based on user adoption across the environments they manage, supplying insights into which users are churning and which ones are sticking around.
You can use the resulting data to perfect the performance of your services and applications and find areas for improvement. Reports incorporated in the Power Platform admin area offer analytics.
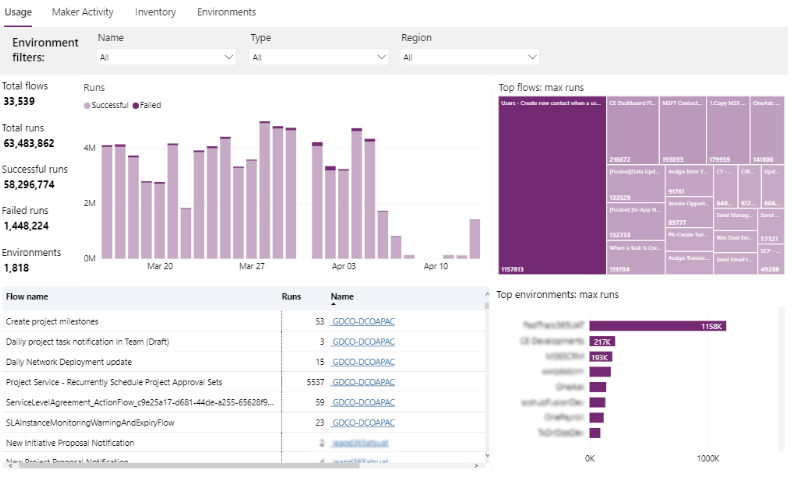
How to Use Usage Reports in Power Automate
Usage reports are a way to track the success of your marketing campaigns. You can check what kind of traffic is coming to your website and which pages have been viewed most often. This data helps you perfect your campaign, and it can also help you make decisions about how you will spend much time, money, and workforce on a particular project in the future.
Maker Revenue and Activity Report
The Power Automate report offers citizen writers details on how cloud flows between tenants or environments. There is data in the information about the number of times a user has published a flow and which version they have published, as well as an analysis of the nature of their contributions. It also supplies an analysis of the contribution history of each user, highlighting those who have contributed more than others and why they are contributing more.
The Inventory Report on Power Automate
The Power Automate Inventory report is an excellent way to view your entire cloud flow catalog in one place. This view offers filters that allow administrators to find flows based on a variety of parameters.
The report shows the following:
- A list of all the flows in your tenant
- A summary of each flow, including its name, description, and status
- An image of each flow’s configuration
- A listing of which customers are using each flow
Microsoft’s Power Platform Reporting Analytics
Microsoft’s Power Platform Reporting Analytics is a tenant-level reporting tool for the Power Platform. It will allow you to see key performance indicators for your tenants and apps on the Power Platform canvas and model-driven apps and drill down into more specific information about your tenants using geo-location data.
After you’ve completed the tenant-level reporting enabling, navigate to PPAC and select Analytics – Power Apps. After enabling the functionality, you may not see any data for a while. If you read the terms of service dialog, you’ll notice that the tenant-level reporting feature will aggregate data from different environments into the geo of your tenant’s default environment. So, presumably, Microsoft will not start the telemetry data publishing into their managed Data Lake until the customer consents for this to occur.
Conclusion
Power Platform tenant-level analytics is an advanced feature that allows administrators to view insights from the telemetry data from all environments they manage. This process helps them make more informed decisions about their infrastructure, simplifies data access, and allows Power Platform admins to automate operations by taking advantage of platform analytics natively built-in queries.
The best way to learn about this product is through training classes or reputable Power Platform consulting partners like EPC Group. In the end, Power BI will change how your business looks at data and analytics, making you more competitive overall


