

Treemaps are used to represent the huge data that is hierarchically structured. Then the visualization will split into more rectangles and be ordered quantitatively. The treemap is visualized as a rectangle containing another rectangle like a level of hierarchy. A column or an interpretation in a data table is displayed in the set of the rectangle on the level of the hierarchy.
A category in a column is represented by each rectangle created on a level of hierarchy. Just take a simple example to understand the treemap, let a bid rectangle as a continent then under this countries present then further small rectangles and state and, cities and towns just like a family tree it is also created similarly, a treemap is directly in the visualization or an already defined hierarchy.
How Shall Be A Treemap?
A treemap should be equal-sized and ordered to determine how the rectangles used several different algorithms. Spotfire uses a qualified algorithm in the treemap. The rectangle size from the top left corner of the visualization to the bottom bright corner, and the largest rectangle in the bottom right corner. The same ordering of the rectangle is repeated for each rectangle in the treemap is when the rectangle is nested. It means the size and the position of a rectangle containing another rectangle with the sum of the areas of the contained rectangles.
How To Use Treemap In Power BI?
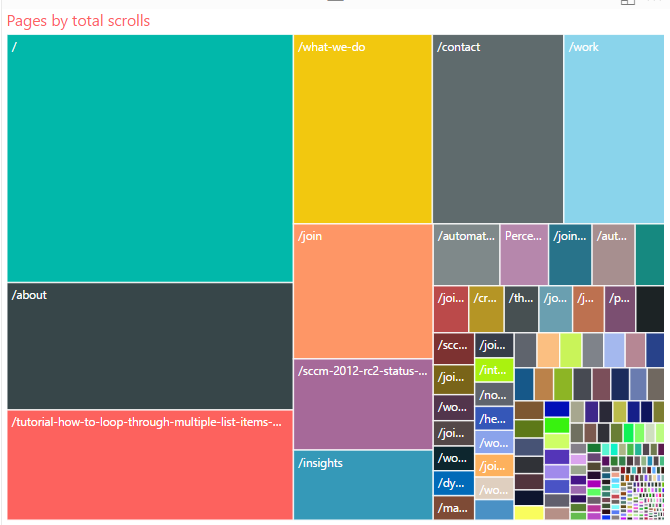
In a tree map the hierarchical data is displayed as set nested rectangles.
A colored rectangular [branch] represents the level of hierarchy and contains shorter rectangles that are called leaves. The Power BI just makes the inside space of the rectangle through a proper measuring value of these rectangles and are arranged in such a way that the largest on the top is less to the smallest at the bottom right.
When to use a Treemap?
You can use the treemaps in following conditions:-
- There are many choices where you can use the tree map.
- When you have to represent a huge amount of data.
- When a pie chart is not effective it takes the burden of a values of huge no..
- Elaborate the proportion of the parts and the complete data table.
- Treemap can also be used to present the distribution pattern of every categorical level in hierarchy.
- By using the coding of structure and colors to represent the attributions.
How To Create A Basic Treemap In Power BI?
Step 1 – The pane selects the sales> measurement of last year sale by field.
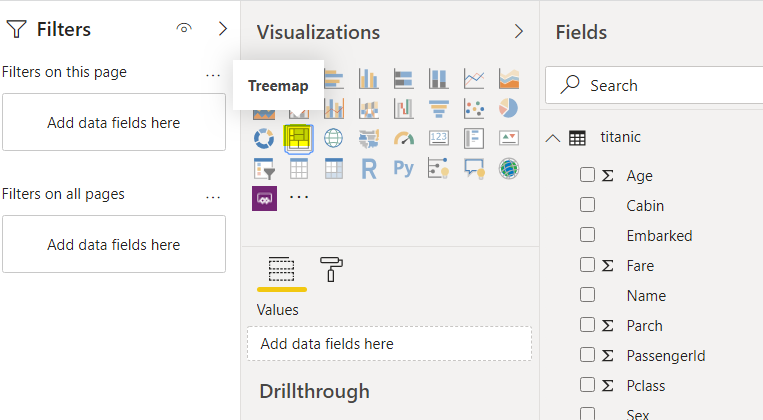
Step 2 – To change the chart into treemap click on the icon of treemap.
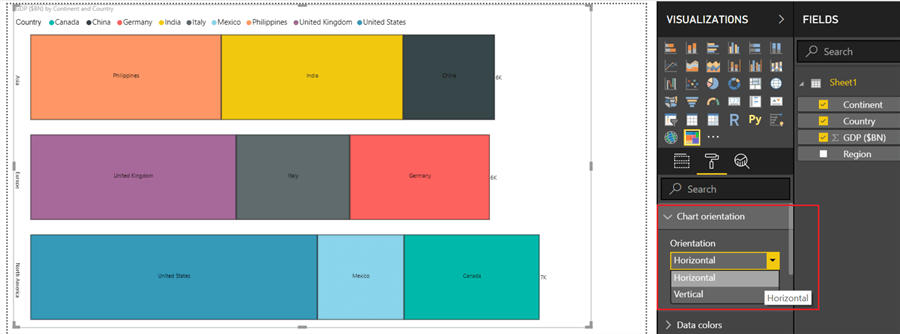
Step 3 – Select item > category which will add the category to the group well.
Step 4 – Treemap is created by Power BI in which the shape and size of the rectangle of treemap is depend on total no. of sales [ or what kind of file you have selected ] and the color represents the rectangular box [category]
Step 5 – Use a hover chain if you are willing to expose the tooltip for a specific category.
How Can You Highlight And Cross Filter In The Treemap?
These are the available visualization options in Power BI for highlighting a particular area. If you are willing to add on some visuals to your treemap and wanted to make it more effective then follow the following steps:-
- First, select any category of treemap or the chain of a treemap that causes the highlighting of other visuals on the appearing page.
- Now cross filters the treemap.
- If you are looking for how to manage cross highlighting and cross filters then you can see in Power BI that how visuals can interact in the Power BI report.
Benefits And Disbenefits Of Preparing A Treemap In Power BI
❖ Benefits
- By using treemap you will get the positive and accurate quantitative value that is expressed in a rectangular area.
- The second qualitative value determines the color of each rectangle.
- Distinct visual borders surround the higher categories so that you can identify the topmost groups.
- When you will select an individual rectangle you will get all the related information such as their name, place, values, and so on.
- When you will click on a rectangle then a visual effect will confirm if they are looking at the right data.
❖ Disbenefits
- These tree maps are not very useful for accurate comparisons.
- Tree maps are not acceptable if the data is not represented in hierarchical form because in such conditions they will be equal to the pie chart.
- You can’t make a balanced tree map because a tree map only represents a large amount of product among all of them.
Conclusion
In this article, we described the treemaps and how it is prepared in Power BI, with all the possible benefits and disbenefits. We hope that you all get the answers related to your question. If you are looking for consulting for Power BI as business intelligence tool then reach out to EPCGroup


