
Are you confused regarding the use of Tooltips in Power BI? If yes, we are here to help you out. In this blog, we will tell you what tooltips do in power BI. Let us first explain the tooltip to you and then it will be easier for you to understand its role in Power BI.
Scroll down and read!
What is Tooltip in Power BI?
Tooltips are the easy and elegant way of demonstrating more contextual data and information in detail into points on a visual. When visualization is provided with the help of tooltips, the values and categories can be displayed using it.
The customize tooltips can also be used to provide the information more accurately. When the customization in tooltips is used, it can give additional information and context for the users. Tooltips enable the user to point to additional data points present as a part of the Tooltip.
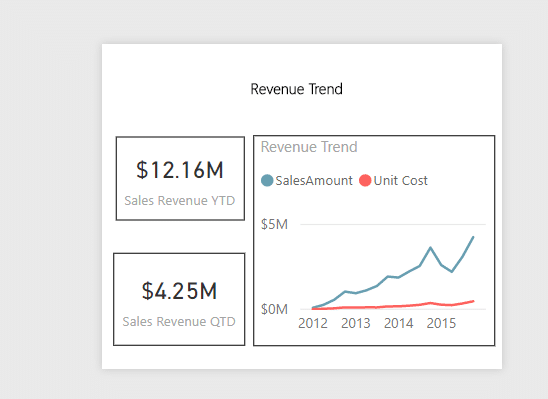
In Power BI reports, many kinds of features are used to improve their reporting style. When the cursor drifts a visual, the tooltips appear. Every visual will not have the tooltips. Tooltips are very much useful as they show deep trends within the database. You can also refer to tooltip as a hint, info tip, or screen tip.

How Does Tooltip Work In Power BI?
In Power BI, ToolTip Icon works more like a hint or tip on the screen. You can enable this on each visual.
- Uses
- Visual annotations
- Business logic explanation / Calculations
- How to navigate around the visual
- Show more data related to visual
- Visual Annotations
In this digital world, annotations can be seen interactively. With tooltips, one can enjoy the little annotations for daily reports. With the help of these tooltips in power BI, the canvas space can be used wisely.
- Business logic / Calculations explanation
Business logic is one of the other uses. Having some explanation about the calculations can be very easily done with tooltips. Here all of them work towards a common goal, so to cope with this, tooltips will be an easy and helpful method to make metrics more understandable.
How To Navigate Around The Visual?
It is not that easy to explain every metric easily. So there you will need some extra features like Tooltips and drill down and drill up functions. So to handle this better, Tooltips can be helpful and handy. With proper guidance one can understand things easily with a tooltip.
Show more data related to visual– With the help of Tooltips, you can focus on one thing. It will help to focus on it and show only related information. This will be very useful for the user. Tooltips can be more helpful here.
Steps To Create Report Page Tooltips In Power BI
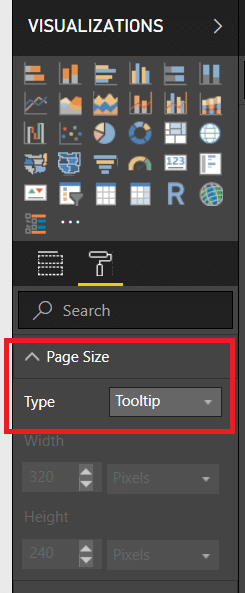
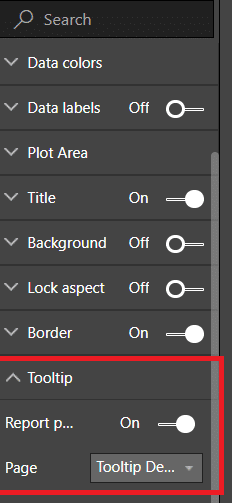
- Create a new Page and Within that page, navigate to the Format pane and expand Page Size.
- Within Page Size, select Type to be Tooltip.
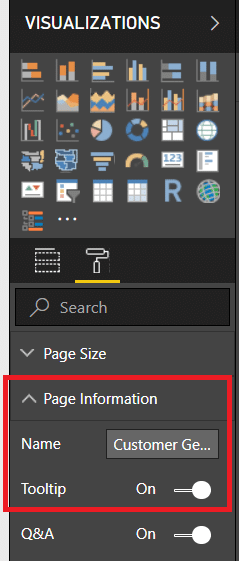
- Next, go to the Page Information section and make sure Tooltip is set to on.
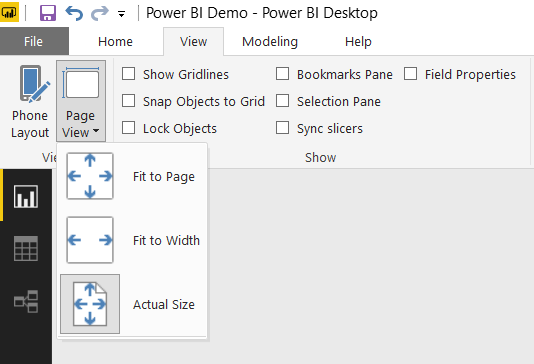
- You have to make sure the page view is set to Actual Size. Have to use the actual canvas space with the Tooltip.
- Now start building your Tooltip. You can use any combination of visuals for that. It’s just like creating a report in Power BI.
- Finally, apply this to the chart you want to use. Navigate to your chart and select it. Now turn the Tooltip on and under Page select the Tooltip you just created.
What Are The Limitations And Compensation Of The Tooltip?
You can’t use a tooltip on any system. Like other tools, tooltip also has some limitations and attention to follow. Those are given below:
- Tooltips are also supported by button visuals when the Power BI Desktop was released at the beginning of December 2018.
- Power BI visuals don’t support reports of tooltips.
- When you choose the field of the tooltip to show your reports by using a field versus or a category then the visuals which have this file will only represent a specific tooltip on selecting the summarized selected field matches.
- Tooltips reports don’t support the cluster of fields.
What Are The Advantages Of Tooltips?
Some people consider tooltip a trouble maker but it has more advantages than making trouble for the users. Continue reading to know the benefits of the tooltip.
- You can use tooltips so that they can provide contextual help like they hind and message to your website for decisions.
- Users usually don’t work what they don’t understand. Tooltips help the users to understand the complex features of the system.
- A tooltip will help to find our accurate data and assist them in form fields.
Summing up
So this is how Tooltips work in Power BI. It makes visual representation easier and more effective. A Tooltip can be easily customized, giving users an opportunity to create more interactive reports.
We at EPC Group provide Power BI Consulting Services, Microsoft Power BI Embedded Consulting & Training Services, and many more for Business Intelligence implementation. Also, we have a wide variety of industry experience with all sorts of custom requirements for Power BI dashboards. We are also Microsoft Certified Gold Partner and can help with a custom implementation.
Fill In The Form For – FREE 30 Mins Power BI Consulting


