

Power BI is a versatile and powerful data visualization tool that allows users to analyze and present data through interactive reports and dashboards. One common issue that users face is Power BI automatically presenting a count of values instead of the desired aggregation or measure.
This can happen when you drag a numeric field into a visualization, and Power BI defaults to showing a count of the values.
In this article, we’ll go through a few methods to stop Power BI from presenting a count of values and ensure that your data is displayed in the desired format. By understanding these methods, you can better control your visualizations and create more accurate and meaningful reports.
Understanding the Fundamentals of Power BI Count Functions
The Count function in Power BI is an aggregation method that calculates the total number of occurrences of a specific value or data point in a given dataset. This feature is very beneficial when understanding the frequency or distribution of certain values within your data.
For example, you may use the Count function to determine the number of sales transactions for a specific product or the number of customers in each region.
In Power BI, several types of count functions exist, each serving a different purpose. Here are the main ones:
COUNT

Syntax: COUNT(<column>)
This function calculates the number of rows with non-blank values in a column. It is mainly used to count numeric values but can also work with text and date columns.
COUNTA

Syntax: COUNTA(<column>)
The COUNTA function is similar to COUNT but counts all non-blank rows, regardless of the data type.
COUNTX

Syntax: COUNTX(<table>, <expression>)
COUNTX is an iterator function that counts non-blank values in a column, but it allows you to use an expression to filter or modify the data before counting. This is useful when applying a specific condition before counting the values.
DISTINCTCOUNT

Syntax: DISTINCTCOUNT(<column>)
This function counts the number of distinct, non-blank values in a column. It is helpful when you want to find the count of unique occurrences within your dataset.
COUNTROWS
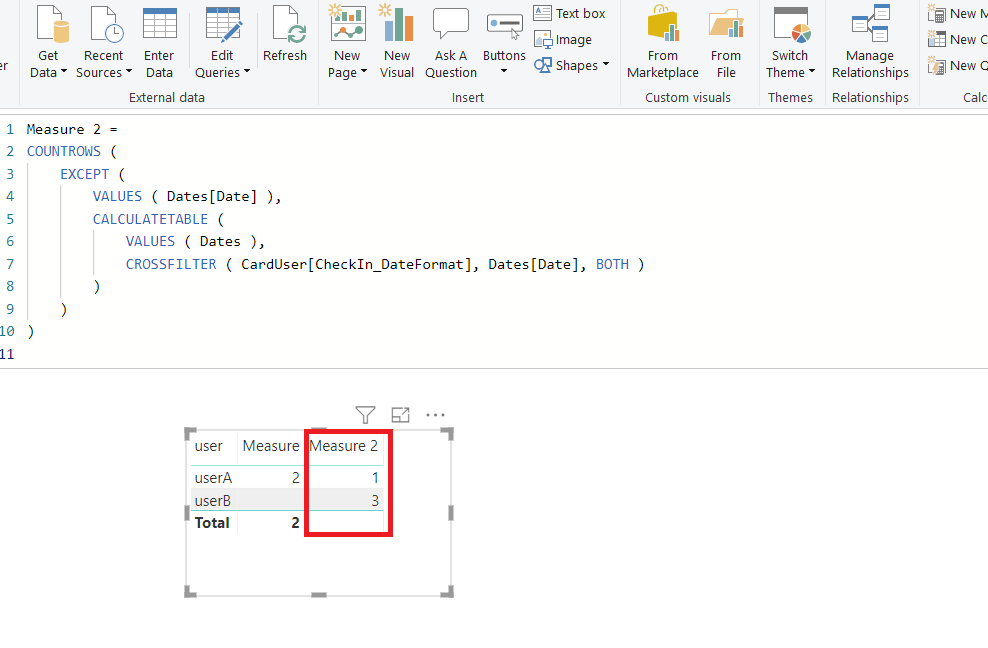
Syntax: COUNTROWS(<table>)
With the COUNTROWS function, you can determine how many rows in a table satisfy a given condition or filter.
COUNTBLANK

Syntax: COUNTBLANK(<column>)
This function counts the number of blank or empty cells in a column.
Power BI Count Functions Use Cases
Power BI Count functions can be applied in various use cases to analyze and present data effectively.
Here are some common scenarios where these functions are useful:
- Sales analysis: Use the COUNT or COUNTX function to count the number of sales transactions or DISTINCTCOUNT to identify the number of unique products sold within a specific period.
- Customer segmentation: Analyze customer demographics by using COUNT or COUNTROWS to count the number of customers in different age groups, geographic locations, or other categories.
- Inventory management: Use DISTINCTCOUNT to find the number of unique items in stock or COUNT to track the total quantity of each item.
- Survey analysis: Apply the COUNT or COUNTA function to count the number of responses to specific survey questions or COUNTROWS to count the number of respondents who meet specific criteria.
- Website traffic analysis: Use COUNT or DISTINCTCOUNT to calculate the number of unique visitors to a website, COUNTROWS to identify the number of visits that resulted in specific actions, or COUNT to track page views.
- Quality control: Apply COUNT or COUNTX to count the number of products with defects, or use COUNTROWS to count the number of products that meet a specific quality threshold.
Step-by-Step Guide to Utilizing Power BI Count
Follow this step-by-step guide to utilize Power BI Count functions effectively in your data analysis and visualizations:
Step 1: Import and prepare your data
- Launch Power BI and click “Get Data” to import your dataset from various sources such as Excel, SQL Server, or a CSV file.
- Once the data is imported, use the Power Query Editor to clean, format, and prepare your dataset for analysis.
Step 2: Create a new measure or calculated column
- In the Power BI Data view, select the table where you want to create a new measure or calculated column.
- Click “New Measure” or “New Column” from the Home ribbon.
- Type the appropriate DAX formula using the desired count function in the formula bar. For example:
- To count the number of sales transactions: TransactionCount = COUNT(Sales[TransactionID])
- To count the number of unique products: UniqueProductCount = DISTINCTCOUNT(Sales[ProductID])
- To count the number of customers in a specific region: CustomerCountRegion = COUNTROWS(FILTER(Customers, Customers[Region] = “North America”))
Step 3: Add a visualization to your report
- Switch to the Report view in Power BI.
- Click on the desired visualization type from the Visualizations pane, such as a bar chart, pie chart, or table.
- Drag the newly created measure or calculated column to the “Values” section of the visualization.
Step 4: Customize your visualization
- Format and customize your visualization using the Format pane. You can adjust colors, labels, titles, and more.
- Add filters, slicers, or other interactive elements to your report to help users explore the data more effectively.
Step 5: Publish and share your report
- Once your report is complete, click “Publish” in the Home ribbon to share your report with your team or organization.
- You can also export the report to formats like PDF, PowerPoint, or Excel for further analysis and distribution.
Best Practices for Maximizing Power BI Count Efficiency
| No. | Best Practice |
| 1. | Understand the data: Familiarize yourself with the dataset and its structure before using count functions. This understanding will help you choose the appropriate count function and create meaningful calculations. |
| 2. | Choose the correct count function: Select the most suitable function based on your specific requirements and the data type you are working with. Each count function has a unique purpose and can affect the accuracy of your analysis. |
| 3. | Use measures over calculated columns when possible: Measures are more efficient and dynamic than calculated ones. Use measures for count functions whenever possible, as they improve performance and enable real-time calculations. |
| 4. | Optimize DAX expressions: Write efficient DAX formulas using variables, optimizing filter conditions and avoiding unnecessary calculations. This will improve the performance of your count functions and reduce the overall calculation time. |
| 5. | Filter data before counting: Use filter functions like FILTER or CALCULATE to narrow down your dataset before applying count functions. This will ensure that only relevant data is counted and improve the performance of your calculations. |
| 6. | Use context transition wisely: Be mindful of the context transition when using count functions inside iterators like COUNTX. Make sure the transition is necessary for the calculation, as it can impact the performance of your DAX expressions. |
| 7. | Format your visualizations: Ensure that your visualizations display the count values clearly and easily understandable. Customize labels, titles, and tooltips to provide additional context and insights. |
| 8. | Test and validate your calculations: Always test your count functions with sample data to ensure accuracy and reliability. Validate your calculations against other data sources or calculations to confirm the results. |
| 9. | Leverage Power BI features: Power BI features like slicers, filters, and drill-throughs help users effectively explore the count data. This will provide additional context and make your analysis more interactive. |
| 10. | Keep your data model clean: Organize your data model by removing unnecessary columns, measures, and tables. A clean data model will improve performance and make working with count functions and other calculations easier. |
Unlock the Full Capabilities of Power BI for Advanced Data Analysis and Visualization
EPC Group is a leading Power BI consulting firm that excels in providing comprehensive data analysis and visualization solutions tailored to your organization’s unique needs.
Our end-to-end services cover data preparation, dashboard and report creation, data modeling, DAX formula development, and performance optimization, ensuring that your organization receives a seamless and all-encompassing solution for your data analysis and visualization requirements.
By choosing us for your Power BI consulting needs, you benefit from their expertise and customized solutions and receive dedicated training and support to help your team effectively utilize Power BI.
We offer on-site and remote training sessions and ongoing support to ensure that your team can make the most of Power BI’s capabilities. Don’t give up a chance to change how your business makes decisions using data organization’s data-driven decision-making process.
Reach out to EPC Group today and unlock the full potential of Power BI for your business. Experience unparalleled data analysis and visualization services that drive growth and success.


