Data analytics is an important aspect of running a successful company. When data is used efficiently, it allows businesses to gain a better knowledge of their past performance and make better decisions about their future actions. Data can be used in a variety of ways at all levels of a company’s operations.
What Are the Four Types of Analytics and How Do You Use Them?
The four types of data analysis are:
- Descriptive Analysis
- Diagnostic Analysis
- Predictive Analysis
- Prescriptive Analysis
What is Descriptive Analytics?
Descriptive analysis is the initial sort of data analysis. It is the bedrock of all data analysis. It is the most basic and widespread application of data in today’s corporate world. The descriptive analysis provides a solution to the question “what happened” by presenting previous data in the form of dashboards.
The most common application of descriptive analysis in a company is to track KPIs. KPIs describe how a company is performing in relation to a set of benchmarks.
Business applications of descriptive analysis include:
- KPI dashboards
- Monthly revenue reports
- Sales lead overview
How Do You Get Started with Descriptive Analytics?
Descriptive analytics breaks down into five steps, including:
1. The Business Metrics should be stated.
To begin, the organization must determine the metrics it wishes to generate based on the company’s general goals or the fundamental business goals of each group inside the company. For example, a corporation that prioritizes growth may place a premium on measuring quarterly revenue increases. At the same time, the accounts receivable section of the organization might keep track of good days’ sales and other indicators that demonstrate how long it takes to collect money from consumers.
2. Determine the information that is required.
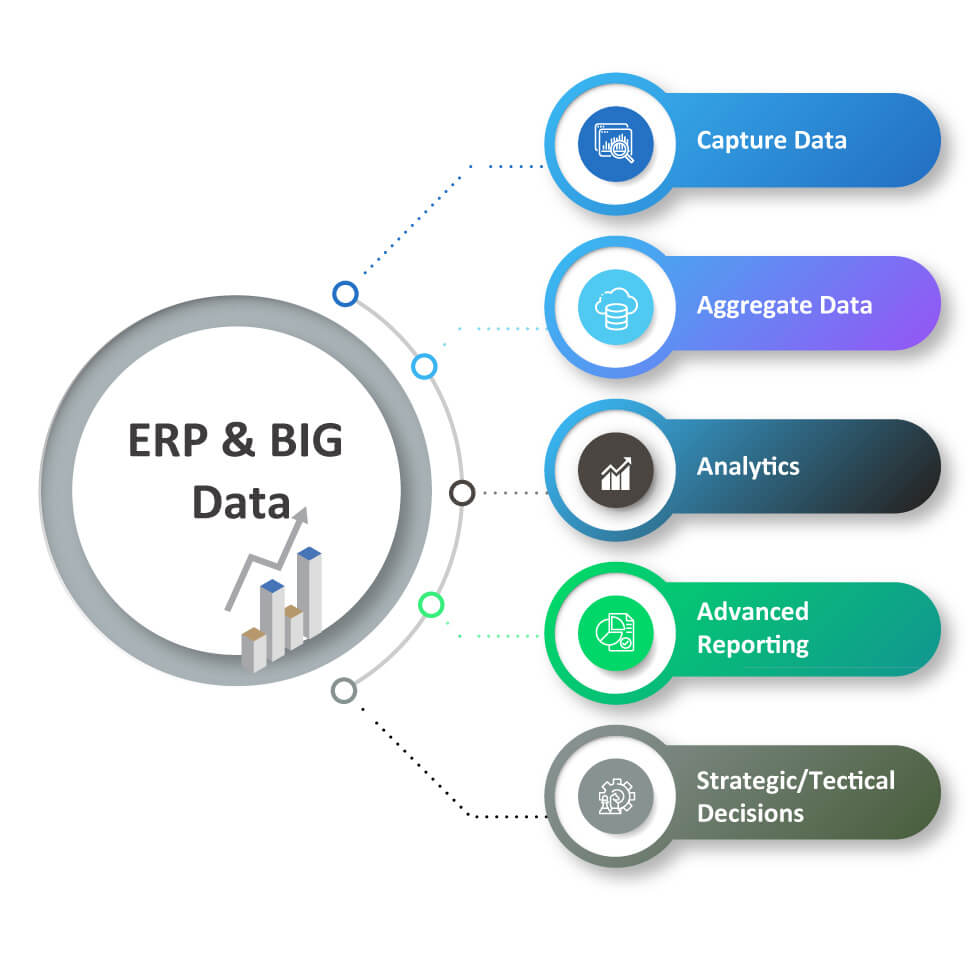
The organization must then locate the data required to calculate the necessary metrics. Because the essential data may be distributed over multiple files and apps, this task may be difficult. Companies that use an Enterprise Resource Planning (ERP) system, on the other hand, may have an easier time as their databases already have most or all of the necessary data.
3. Data extraction and preparation
If the required analytical data comes from several sources, extracting, merging, and preparing the data for analysis might be time-consuming. This is, however, a critical step in ensuring correctness. Furthermore, data cleansing to remove inconsistencies and errors in the data may be required, which is a fair effort given the information coming from a diverse range of sources and the need to convert data into a format suitable for analysis tools. Advanced data analysts employ data modeling, a framework embedded in information systems that aid in the preparation, arrangement, and organization of a company’s data. Data modeling is the process of defining and formatting complex data in order to make it useable and actionable.
4. Analyze the Information
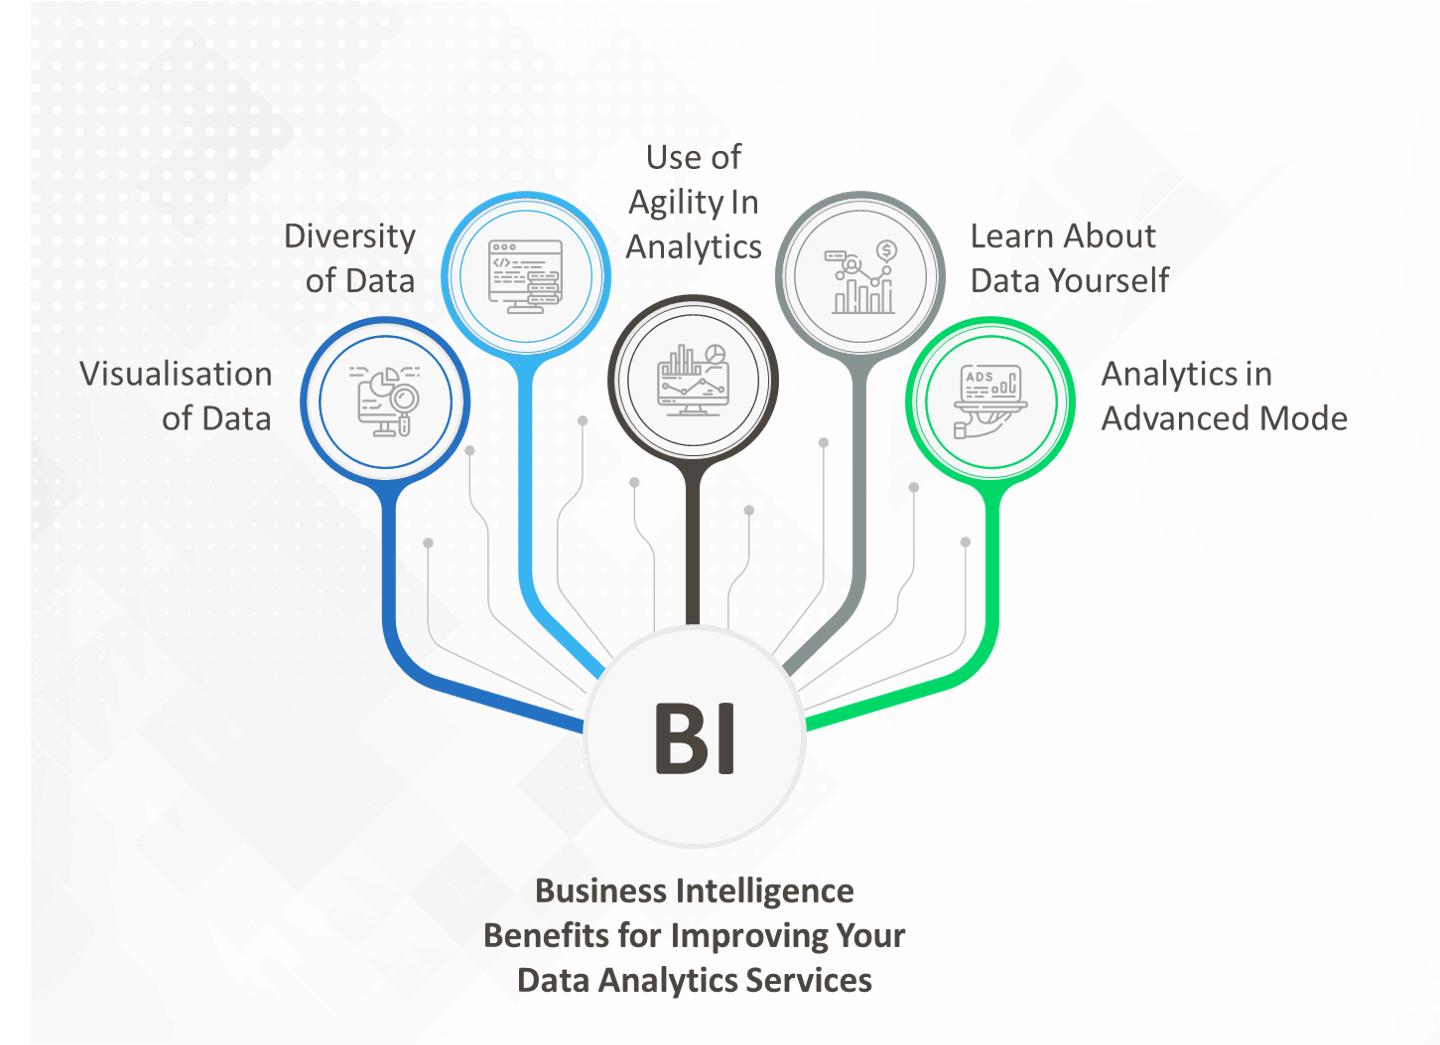
Companies can use a variety of tools to do descriptive analytics, including business intelligence (BI) software and spreadsheets like those available in Excel. In most cases, descriptive analytics entails applying basic mathematical operations to one or more variables. A sales manager, for example, could want to keep track of average sales revenue or monthly revenue from existing or newly acquired clients.
5. Display the Data
All that remains after business analysts have completed all of the essential stages is to deliver the data. However, the data must first be presented in such a way that everyone can comprehend it, from stakeholders to finance experts. Stakeholders frequently prefer reports that are visually appealing, such as bar charts, pie charts, or line graphs. Data that is visible is easier to comprehend. Finance professionals, on the other hand, may prefer data presented in figures and tables.
What is Diagnostic Analytics?
Diagnostic analysis excavates deeper into the descriptive analytics data to reveal the underlying causes of the outcomes. This sort of analytics is used by businesses because it generates more connections between data and detects patterns of activity.
Creating thorough information is an important part of diagnostic analysis. When new problems develop, it’s probable that you’ve previously gathered some information about the situation. Because you already have the data, you won’t have to repeat work and all problems will be interconnected.
- A freight business looking into the cause of sluggish shipments in a certain region could apply diagnostic analysis.
- A SaaS company uses DAaaS to drill down to see which marketing activity resulted in more trials.
“Research shows that nearly 70% of small businesses spend more than $10,000 a year on analytics to help them better understand their customers, markets and business processes.” (online.bath.ac.uk)
How Do You Get Started with Diagnostic Analytics?
Diagnostic analytics uses a number of methodologies to uncover the reasons of trends. These are some of them:
- Drilling down into a dataset can offer more specific details about which components of the data are causing the observed trends. Analysts may, for example, delve deeper into national sales data to identify whether increasing sales growth is due to certain regions, customers, or retail channels.
- Data mining is the process of searching through enormous amounts of data for patterns and correlations. Data mining, for example, could indicate the most common causes of an increase in insurance claims. Data mining can be done by hand or with the help of machine learning technologies.
- Correlation analysis studies the degree to which several variables are connected to one another. On hot days, sales of ice cream and chilled drinks, for example, may spike.
What is Predictive Analytics?
This form of analysis is a step up from descriptive and diagnostic analytics. The predictive analysis employs the information we’ve gathered to develop rational predictions about what will happen next. This research is based on statistical modeling, which necessitates the use of additional technology and labor in order to forecast. It’s also crucial to remember that forecasting is merely a guess; the accuracy of predictions is dependent on high-quality, thorough data.
While descriptive and diagnostic analysis is widespread in the business world, predictive analysis is where many businesses start to exhibit signals of trouble. Some businesses lack the manpower to integrate predictive analytics everywhere they want. Others are unwilling or unable to invest in analysis teams across all departments or to train existing teams.
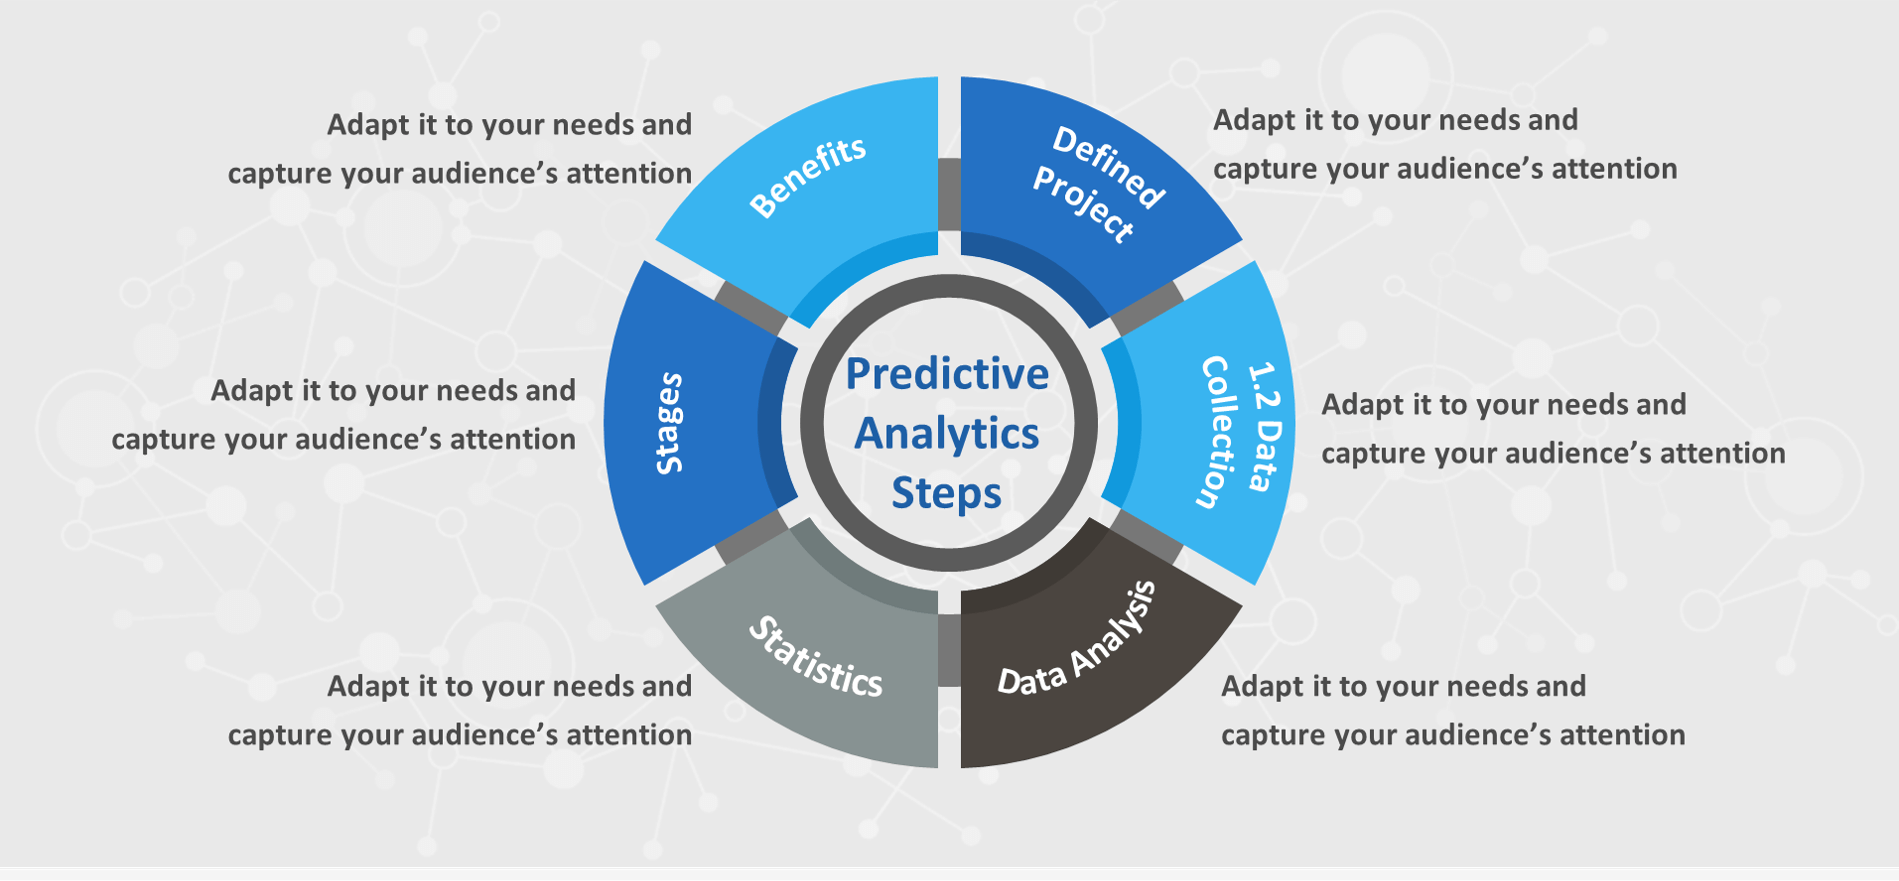
Predictive analytics has a variety of business uses, including:
- Risk assessment
- Sales forecasting
- Using customer segmentation to determine which prospects have the best probability of converting
- Customer success teams using predictive analytics
How Do You Get Started with Predictive Analytics?
Step 1: Identify a suitable predictive application.
This is a crucial part of the project. Choose a business use case that your company already sees as a problem that needs to be solved. Begin by identifying your executives’ top three priorities and selecting the one that is most likely to be accomplished within your timeline. Start with a typical company issue like customer attrition or late payments if you don’t have a particular use case in mind.
Step 2: Identify the information you require.
In many circumstances, the data you require for your specific use case is either unavailable or of poor quality. Consider employing a predictive analytics tool to perform auto cleaning for typical data issues—but don’t wait for everything to fall into place before getting started. After the initial release, you can always issue an update.
Step 3: Assemble a group of beta testers.
Your beta testers are your product’s end users. Directly interact with a few important customers/partners who would be using the predictive analytics in your application if you’re working on a customer-facing project. Assemble a core group of your top users from a number of teams or departments if you have an enterprise application that is used by internal employees or partners. One thing to keep in mind: make sure you have the correct mix of people, so you receive a diversity of responses. Choose clients who will agree with you on everything, not simply the ones who will agree with you on all of it. Your project will never succeed if all you get is favorable comments.
Communicate with the users who will be maintaining and installing the predictive analytics solution in your program along with your end-users. With your development and product management teams, organize focus group meetings and hands-on training sessions. It will not go anywhere if the application team isn’t on board with the solution.
Step 4: Create fast proof-of-concept prototypes.
Develop basic prototypes and get opinions from your stakeholders and end-users. It’s normal for your first few edits to be a little off the mark, but that’s to be expected. It’s not unusual to need a dozen or more modifications to find the ideal design.
Step 5: Incorporate predictive analytics into your activities
Predictive analytics solutions that are most useful are those that are incorporated into existing workflows, procedures, and strategic decision-making phases. Users acquire future insights in the context of the apps they already use, and they can act on them without having to switch to another system. As more users benefit from predictions, even more users will want to adopt the application. The key is to make it easy for end-users to see predictions and take action all within the same application.
Step 6: Collaborate with key stakeholders
Initially, stakeholders may be suspicious of predictive analytics. You may construct a business case to move your idea forward by conducting your due diligence and getting feedback from end-users, sample prototypes, and assessing the competitive landscape. At every stage of the journey, collaborate with stakeholders: you need them to thrive, and they need you to thrive as well.
Step 7: Update regularly
End-users appreciate it when new features are implemented, and bugs are resolved in a timely manner. Make incremental upgrades every two to three months and big updates every six to nine months, according to a predictive analytics plan. To keep your project on track, maintain continual communication with end-users and answer their requests on a regular basis.
What is Prescriptive Analytics?
The final type of data analysis is the most in-demand, but only a few companies are actually prepared to conduct it. The prescriptive analysis is the cutting edge of data analysis, utilizing the knowledge gained from all previous studies to decide the best course of action in a given situation or choice.
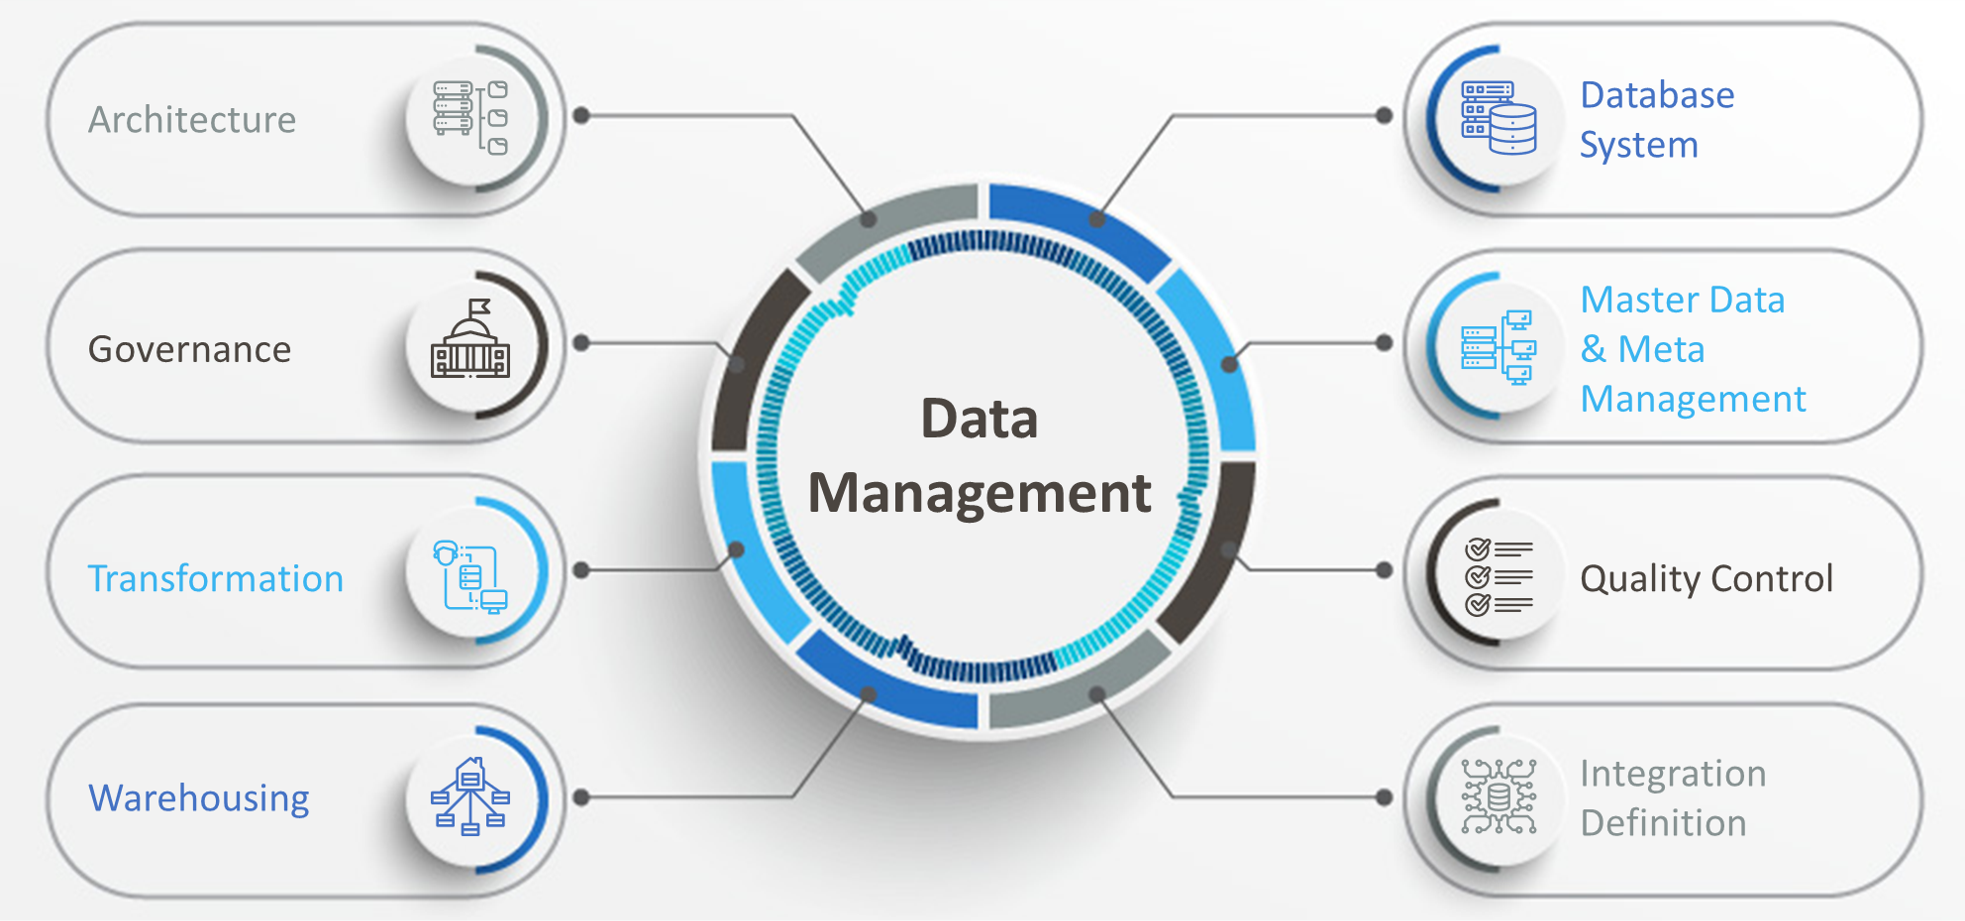
The prescriptive analysis makes use of cutting-edge technology and data management techniques. It is a significant organizational commitment, and organizations must ensure that they are prepared to put forth the necessary time and resources.
Prescriptive analytics is exemplified by Artificial Intelligence (AI). AI systems in data analytics absorb a vast amount of data in order to constantly learn and make intelligent judgments. AI systems that are well-designed are capable of communicating and even acting on these decisions. Artificial intelligence allows business operations to be completed and optimized on a daily basis without the intervention of a human.
Prescriptive analytics and artificial intelligence are currently being used by the majority of big data-driven businesses to improve decision-making. The transition to predictive and prescriptive analytics can be difficult for some firms. More organizations will enter the data-driven world as technology improves and more employees get schooled in data.
How Do You Get Started with Prescriptive Analytics?
- Identify the problem that needs to be solved: Create a first use case, ideally one that isn’t extremely complicated and has a good chance of early success.
- Secure executive support: Confirm that the organization is ready to sponsor and support a proof-of-concept case, particularly in terms of contacting a vendor, redeploying people, and generating a budget.
- Choose the correct technology: Decide how the model will be prepared, who will conduct the task, and which technology will be used. Engage a provider or hire a data scientist if you’re going to build the model from the ground up.
- Evaluate the project’s scope: Determine who will be engaged, if a limited model will suffice, or whether a large-scale project will require the participation and commitment of numerous business users.
- Create a vision: Decide what you want to accomplish.
- Form a group: Form a group that includes a sponsor, project leader, and directing committee.
- Project design: Establish model needs and fine-tune the project’s scope.
- Build and validate the model: Create a model that depicts the issue, populate it with known data, then validate it to ensure it appropriately describes known outcomes.
- Get your data ready: Make a list of all the data you’ll need and alter it as needed so the model can read and use it.
- User interface: Set up an interface that allows users to enter data, run scenarios and interrogate results.
- Test the model: Comprehensively test the model to ensure it works as required and that all bugs are ironed out.
- Implementation and rollout: Start using the model.
What Is Data Analytics?
Organizations can use data analytics to evaluate all of their data to find patterns and create insights that can be used to inform and, in certain cases, automate choices, closing the gap between intelligence and action. From access to data, formulation, and analysis to implementing analytics and monitoring results, today’s top technologies cover the end-to-end analytical process.
Data analytics enables businesses and cultures to digitally transform, becoming more inventive and forward-thinking in their decision-making. Companies can develop tailored consumer experiences, generate connected digital goods, optimize processes, and increase staff productivity by altering the paradigm beyond data and connecting insights with action.
Organizations use collaborative data analytics to enable everyone from data engineers and data scientists to developers and business analysts, as well as industry professionals and business executives, to contribute to business success. Collaborative data analytics empowers internal and external stakeholders to interact and collaborate.
Data analytics moves businesses forward by infusing algorithms throughout the organization to optimize important business moments like a customer entering your store, a piece of equipment about to malfunction, or other occurrences that could mean the difference between winning and losing business. Data analytics can aid in the prediction and management of disruptions, the optimization of routes, proactive customer service, smart cross-sell offers, the prediction of approaching equipment failure, real-time inventory management, pricing optimization, and fraud prevention.
What is self-service data preparation?
Self-service data preparation is the next big thing in data transformation, it’s important to know how it fits into the workplace. Self-service reporting gives business users immediate access to the data analysis source, which is comprised of customized components selected by the end-user. This easy accessibility, along with the fact that there are few to no training requirements, eliminates the middleman, resulting in a remarkably efficient business process. Not only that, but self-service analytics enables you to get the most out of your data, platform, or application, as well as your cycle time.
How can data analytics improve business decisions?
Data analytics can help businesses make better decisions and reduce financial losses. Predictive analytics can forecast what will happen as a result of business changes, while prescriptive analytics can recommend how the business should respond to these changes.
For example, a company can simulate changes in price or product offerings to see how these affect client demand. A/B testing of product offerings can be used to validate the hypotheses generated by these models. Businesses can use data analytics tools to evaluate the effectiveness of the modifications and visualize the results to help decision-makers decide whether to roll the modifications out across the firm after gathering sales data on the altered items.
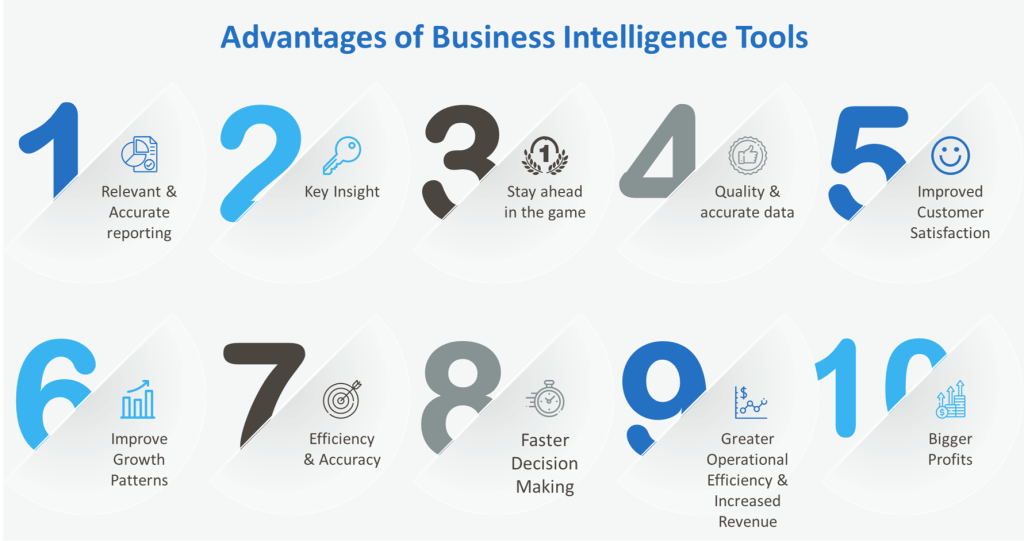
What Is Data Analytics in Business?
1. Make the customer’s experience unique.
Customers’ data is collected through a variety of channels, including physical retail, e-commerce, and social media. Businesses can get insights into customer behavior by utilizing data analytics to assemble complete customer profiles from this data, allowing them to give a more personalized experience.
Take, for example, a retail apparel store with both an online and physical presence. The business might combine sales data with information from its social media pages to build targeted social media campaigns to drive e-commerce sales in product categories where customers are already interested.
Behavioral analytics models can be run on client data to improve the customer experience even more. For example, a company could use e-commerce transaction data to construct a predictive model to identify which products to promote at checkout in order to boost sales.
2. Make operations more efficient.
Data analytics can help businesses enhance their operational efficiency. Data regarding the supply chain can be gathered and analyzed to uncover the source of production problems or bottlenecks, and also predict future concerns. If a demand assessment suggests that a particular vendor will be unable to handle the seasonal influx, an organization can augment or replace that vendor to avoid production problems.
Furthermore, many organizations, particularly those in the retail industry, have difficulty optimizing their inventory levels. Based on characteristics like seasonality, holidays, and secular trends, data analytics may assist establish the best supply for all of an organization’s products.
3. Reduce risk and deal with setbacks
In business, there are risks everywhere. Customer or employee theft, uncollected receivables, staff safety, and legal responsibility are just a few of them. Data analytics can assist a company in identifying hazards and taking preventative steps. For instance, a retail chain might employ a proclivity model — a statistical model that anticipates future actions or occurrences — to determine which locations are most prone to theft. The corporation might can then use this information to determine the level of security needed at the stores and whether or not to divest from any of them.
Data analytics can also be used by businesses to limit losses following a failure. If a company overestimates demand for a product, data analytics can be used to figure out the best price for a clearance sale to manage inventory. An organization can even construct statistical models to give recommendations on how to handle recurring issues automatically.
4. Boost security
Data security is a concern for all businesses. By analyzing and visualizing relevant data, organizations can use data analytics to identify the reasons for previous data breaches. For example, to discover the course and origins of an attack, the IT department can adopt data analytics software in order to analyze and visualize audit logs. This data can assist IT in locating and patching issues.
IT departments can also utilize statistical models to avoid future attacks. In attacks, particularly load-based assaults like a distributed denial-of-service (DDoS) attack, unusual access behavior is prevalent. These models could be set up to run endlessly, with surveillance and alerting systems layered on top to detect and flag anomalies so security experts can respond swiftly.

Who Needs Data Analytics?
To be competitive, a company must make quick, agile decisions, and big data analytics is almost certainly a part of that process. Data analytics has a wide range of uses. Big data analysis can improve efficiency in a variety of businesses. Businesses can flourish in an increasingly competitive environment by improving their performance.
In the banking and finance industries, data analytics is used to forecast market trends and analyze risk. Credit ratings are an example of data analytics that has a wide range of applications. To estimate loan risk, these scores employ a variety of data points. Financial institutions utilize data analytics to detect and prevent fraud in order to increase efficiency and minimize risk.
However, data analytics may be used for more than just increasing revenues and ROI. Healthcare, crime prevention, and environmental preservation can all benefit from data analytics. These data analytics applications make use of these tools to make the world a better place.
Though statistics and data analysis have long been employed in scientific study, modern analytic tools and big data have opened up many new possibilities. These methods can be used to find patterns in complex systems. Machine learning is currently being used by researchers to safeguard wildlife.
In healthcare, data analytics is already widely used. Data analytics is altering healthcare in a variety of ways, including predicting patient outcomes, distributing funding more efficiently, and improving diagnostic tools. The pharmaceutical industry is likewise being transformed by machine learning. Drug development is a complex process with many variables. Machine learning can help with drug discovery in a big way. Data analytics is used by pharmaceutical companies to fully understand the drug market and forecast sales.
Machine learning is used in conjunction with the internet of things (IoT). These gadgets open up a lot of possibilities for data analysis. Many sensors are commonly found in IoT devices, which capture useful data points for their operation. To manage heating and cooling, devices like the Nest thermostat track movement and temperature. Data can be used by smart gadgets like these to learn from and predict your behavior. This will enable advanced home automation that adapts to your lifestyle.
Data analytics has an apparently limitless number of uses. Every day, more data is gathered, opening us the fresh potential to apply data analytics to more aspects of business, science, and daily life.
“Yet, according to ZDNet, 90% of all spreadsheets have errors that affect their results”. (oracle.com)
Conclusion
To conclude, here is everything you need to know about data analysis. Each of the types of data analysis listed above is interconnected and relies on one another to some extent. They all serve a different purpose and offer different perspectives. Moving from descriptive to predictive and prescriptive analysis necessitates a higher level of technical expertise, but it also provides greater insight for your company.


