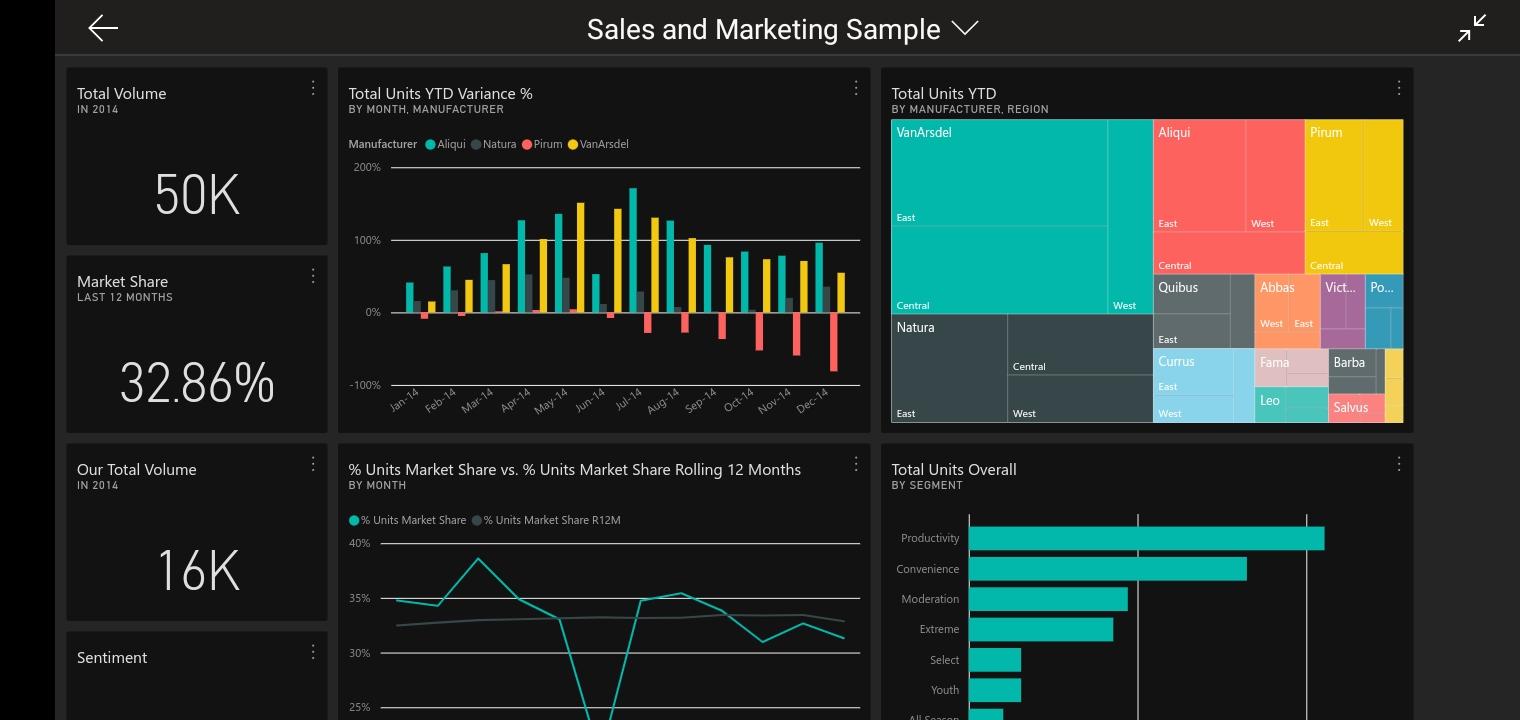
The term ‘Power BI mobile apps’ refers to a set of customizable software applications for the mobile device. These work together to bring about coherence in the uncoupled data sources and further provide visually enticing insights. The applications can be used on various iOS, Android, and even Windows 10 devices. Data here refers to excel spreadsheets, set of cloud or on-premise data warehouses.
This further aids business organizations to easily connect to data sources and create mobile reports in Power BI. It also helps visualize and detect the important pieces of information that can be further shared with others.
Sharing and consumption of reports through Power BI apps:
‘Sharing’ implies the action of providing access to another individual or organization to one’s data. Through sharing an individual or organization gains access to the dashboards and reports present in Power BI Service. Whereas, when you share an interactive report, the receiver can only view and interact with the data but will be unable to edit it.
The process of sharing reports through the Power BI mobile apps is as explained in the following steps –
- Step 1. You can share a report from both an already opened report or a list of created reports. From the list of reports or an opened report, click on ‘share’.
- Step 2. Next, the user has to fill the description box with the email ID of the individual, distribution groups, or others. But you must remember that this process of sharing cannot be completed with vigorous distribution lists. While sharing with email addresses outside the organization, the Power BI mobile app will show a sign of warning.
- Step 3. If felt needed, a message can be added along with the shared report.
- Step 4. While sharing within the organization, to permit the co-workers to further share the report, click on ‘Allow’. Permitting others to share or ‘reshare’ the report enables to do so from the Power BI Service and mobile apps. Alternatively, you can send an invitation to others in the organization to view the report. The invitation expires a month from the date it is sent.
- Step 5. When you select ‘Allow’, the users can create fresh content using the other datasets in the same report if required.
- Step 6. Finally, click on ‘Share’ to complete the process.
Call Us Today For Your Free Power BI Consultation (888) 381-9725
The feature of ‘Annotate’ in Power BI mobile :
The term ‘ Annotate’ signifies adding notes to a text to magnify the reader’s capacity for understanding the text. Power BI mobile apps enable their users to perform the same function in their iOS, Android or Windows 10 devices. The user can annotate a certain portion of tile, report, or any visual from the Power BI mobile app.
The individuals or group(s) receiving the annotated text can see it in the same manner, it was before sending. This annotated text is also accompanied by a link. These annotations can be in the form of lines, texts, or stamps. The recipients of this text can click open the link and access the original tile, report, or visual. The process of annotation is as follows-
- To begin with, the annotation bar has various actions to choose from. There’s an icon that looks like a zig-zag line, used to draw lines of any shape, width, and color. To type a certain text, click on ‘AA’, after which the color and font of the text can be chosen. If you have to add an emoticon, the smiley-faced icon has to be clicked. Also, you can choose its color and position.
- The upper right corner of the screen will have the option of ‘Share’. This has to be clicked after the text has been annotated.
- The sender now has to open his mail and enter the recipient’s name. If required, the message can also be modified.
- Finally, click ‘Send’.
Microsoft Power BI data alerts: Utility
‘Data Alerts’ generally implies the alerts sent by a server to any iOS, Android, or Windows 10 device. This is to warn them about exceeding a certain data limit. In Microsoft Power BI, these data alerts perform a slightly different function. Setting a certain data alert in the Power BI Service enables the service to send a notification to the user. Stating that the data in the instant dashboard has crossed the set data limit.
In the field of business, this function of Power BI Service is specifically beneficial. As it aids in addressing rapid changes in the business and is often advised by business intelligence consulting services. Organizations that have data-based functioning reap the benefits of this function. The utility of this feature is as stated in the following manner :
- Organizations are heavily dependent on the patterns of their data usage. And a slight change or variation in the data can affect the functioning of the company to a great extent. Data alerts serve the purpose of warning users of the change in data patterns just in time to fix those.
- If a certain dashboard is published to the users of Power BI Service, the data alerts can intimate them about the variation in the value of the card beyond a certain limit.
- Data alerts are completely synchronized that makes them easier to set.
- The data alerts are not visible to any person other than the one setting them.
Power BI Mobile Apps: The design element
The Power BI Mobile Apps are laden with powerful design tools and mobile layouts. You can use those to create visually stunning dashboards or reports. These features increase the user’s adoption of the services. Moreover, the visually attractive reports let the viewer process information at a greater speed. Also, it is compatible with Phone layout in landscape orientation.

When the user creates a style guide for the usage of the design elements, it enhances the viewer’s experience. Thus, bettering the user’s experience for interactive reports. A proper style guide should incorporate and enumerate the following basic design elements for making mobile-optimized report page(s) –
- Font. If there exists no specific regulation of using a certain font, there are an array of fonts to choose from. While creating a report or dashboard.
- Colour. In a situation where an organization confirms to a certain code of colors, the RGB and CYMK codes for company colors can be incorporated into the settings of the theme.
- Logo. It is essential to use the logo of the company or organization while creating a report or dashboard for it. The style guide must determine the size, color, and position of placing the logo.
There are specific parts of the design elements that enhance the user experience for reports in mobile (Android & iPhone). Those are as follows –
- Backgrounds: These lay a solid backdrop for the report design and enhance the viewer’s experience. Also, a well-placed background is capable of masking any mistakes in the mobile-optimized report.
- Separators: Separators such as commas or semicolons increase the clarity of the text. And improve the viewer’s understanding of the text as well.
- Visual borders: The use of visual borders aid the user to process the data with a few clicks.
Dashboards, Reports and KPIs: Advantages

The various benefits of the Power BI Service can be reaped through the use of the following –
- Dashboards:- The use of dashboards are manifold and their benefits are as stated below-
- Visually enigmatic dashboards screens to aid in identifying the current trends of the business arena.
- The use of dashboards results in increasing the efficiency with which organizations make decisions and perform functions.
- You can achieve complete accuracy in listing the data if dashboards are correctly created.
- Using dashboards provides flexibility to the user to add other points if and when required.
- Reports:- The Power BI reports are based on an individual set of data. Designers, Report authors of a report file, use various report page visuals in Power BI report builder. This is done to arrange the pieces of information in a manner that can be understood by the report readers.
The layouts for reports do not stay stagnant, rather they update themselves with the changing data. You can also create author reports with ease in the Microsoft BI. This provides the best possible app experience to the authors.
- KPIs:- The Key Performance Indicators, abbreviated as KPIs are used as indicators to depict or measure the level performance of an organization in comparison to its set targets.
Power BI Reports to Power BI Mobile: Moving for convenience
In order to create a mobile-optimized report, the following steps need to be followed –
- Open the above ribbon and choose ‘Mobile Layout’.
- From the Power BI Service select ‘Edit Report’ and later select ‘Mobile Layout’. In case the Edit option is not available, then search under ‘More’ options.
Conclusion :
The Microsoft BI mobile apps are designed in a way to provide the best user experience. So that individuals or organizations using it can make the most of it. In order to grow and develop their business to its optimum potential.
Try the apps yourself and reap maximum benefits from the wide range of services they provide.


