

Are you using Power BI? Do you have experience working with PowerApps? Are you planning to integrate Power BI with PowerApps? If so, this post is for you.
Power BI and PowerApps are critical parts of Microsoft Power Platform. Once you use the tools offered by Power Platform, you can enjoy lots of business opportunities. For more information, feel free to check our Microsoft Power Platform Consulting Services.
Every business owner dreams of creating a customized business app where they can connect all their critical data in a single location. Well, that is possible with Power BI and PowerApps integration. You can also possibly promote BI sharing across the organization using a single app or even build an application where your customer can see real-time data information.
With Power BI and PowerApps integration, you have a bigger picture and more significant insights into your business while making the most of your information.
In this post, you will get more familiar with Power BI Integration and PowerApps integration and their benefits to your business.
Microsoft Power BI Platform Overview
The MS Power Platform refers to the business app platform combining the excellent capabilities of Power Virtual Agents, Power Automate, Power BI, and PowerApps. It was built to support businesses of all sizes in building a strong and reliable end-to-end business solutions.
The Power Platform is also designed to help an organization create new opportunities while gaining a competitive edge. These things are possible by linking your business data using the Dataverse (Common Data Service) and a library of Connector.
Through the Power BI and PowerApps unification, you will witness a masterful and excellent integration capabilities.
Power BI Overview
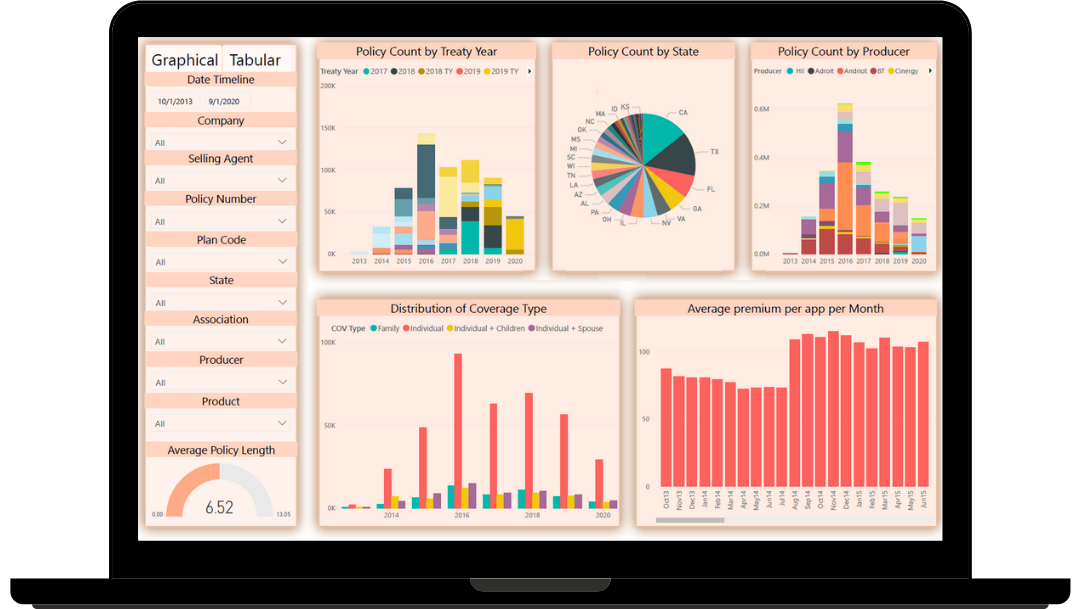
Power BI is dedicated to transforming any unrelated information sources into interactive, visually appealing, and coherent insights as a set of tools running together. Once you utilize the brilliant collection of software services, extensions, and applications, you will have a clear picture of the things taking place on every business level.
This platform consists of three different elements: Power BI Mobile apps, Power BI service (SaaS BI), and Power BI Desktop. If you wish for particular reporting capabilities, you can add the Power BI Report Server.
Another critical feature of Power BI is its capability of connecting information from different sources and discovering what’s essential.
With Power BI and its scalability, your team has an excellent opportunity to customize a BI dashboard. They can also present critical information and data in multilayer forms. If you have international data centers, interactive data visualization sharing is possible.
PowerApps Overview

PowerApps in Microsoft refers to the enhanced app development environment that allows you to build robust and custom applications. It comes with an excellent collection of applications, data platforms, connectors, and services necessary for speeding up the entire app development process. Even if you are not a developer, you have a chance to develop automation and apps to boost your team’s productivity.
Using PowerApps allows you to leverage the tools set and build a custom business apps. You can integrate these applications with on-premise or online data sources. As per Power Apps consultant, the business applications you created with PowerApps guarantee dynamics in business logic and boosted workflow capabilities.
How to Integrate Power BI with PowerApps
Power BI and PowerApps work together no matter who hosts them. Once you combine these two platforms, you can build business applications that deliver powerful visualization and analysis. The apps you created with Power BI and PowerApps integration also enable you to act right away from anywhere and anytime.
Now, let’s see how to integrate Power with PowerApps seamlessly
Step #1: Create a Data Set
First, you need to create a data set dedicated to the Power BI report. You can utilize the SQL Server as your source alongside Adventureworks as your data.
Step #2: Create an InvoiceData Table
Next is to create an InvoiceData table. Then, insert the data into the table for the reporting.
Step #3: Create a Power BI Report
After creating the InvoiceData table, you need to create a Power BI report. Do it by opening your Power BI desktop. Then, utilize the “Get Data” option to have a connection between the InvoiceData table. Select data connectivity as DirectQuery or Import according to the data refresh requirement.

Step #4: Publish the Power BI Report
Ensure to leave some space in the canvas since you will add PowerApps visual control later on. Then, publish the Power BI report to the Power BI service.
Step #5: Calculate the Due Over Delays
Now, create a calculated column with DAX to help you calculate the Due over days. Use the formula: Due Over (Days) = DATEIFF (DueDate,Today(),DAY).
Step #6: Switch to Report Edit Mode
Once you have successfully published the Power BI report to the Power BI service, it’s time to switch to report edit mode. Then, you have to insert the PowerApps visual report in the Power BI report. After that, you will see instructions that will help you get started.
Step #7: Choose the Fields
Select the fields you wish to include in the application. After you added the first field, the visual of PowerApps will ask you to select “Create new” or “Choose app.” Ensure to click on the “Create new” option if you have not yet created an app from the Power BI service.
Step #8: Design the Application
After you clicked the “Create new,” you are headed to the PowerApps studio. From there, you can design the application. A function known as PowerBIIntegration enables the PowerApps to perform data connection and refresh.
Step #9: Adjust and Design the Default Gallery Layout
The next step is adjusting and designing the default gallery’s layout. For instance, you can create two screens. The first screen may display the customer and order details, while the second screen may enable you to send emails to the selected customers.
Step #10: Create the Item Controls
Once you are done adjusting and designing the layout, you need to create the item controls. Then, ensure to change the data points dedicated to gallery items. You can utilize the “ThisItem.ColumnName” for your existing record in the form or Gallery form.
Step #11: Add a Screen for Email
Now, you have to add the second screen for email. On the Home tab, you need to click on the new screen. Next is to choose blank. Ensure to add a HTMLText, text controls, and label control for the email body. Then, do not forget to design the second screen.
Additionally, ensure to set your text property to “gallery1.selected.columnname”. That way, you can quickly populate the values on the second screen according to the first screen selection.
Step #12: Add an Email Icon
Next, you need to add an email icon wherever you prefer like on the top right. You will use it for sending an email. Then, select the “OnSelect” property alongside the expression: Office365.SendEmailV2(TextInput1.Text,SubjectTxt.Text, HtmlText1.HtmlText); Notify( “Mail Sent :)”,Success)
Step #13: Name the Application
For the last step, you need to give your application a name and then save it. After that, you have to switch back to the Power BI report. A newly created app is showed by the PowerApps visual in the Power BI report. Then, save that Power BI report.
Why Integrate Power BI with PowerApps
Power BI and PowerApps integration bring uniqueness to a business’s market. If you have the opportunity to create multi-faceted business applications, you can efficiently meet all your business requirements. You also have the chance to shape the future of your business.
The integration of the two platforms enables you to transform your ordering process and ERP inventory management. You can use real-time data to ensure more accurate and faster inventory management and ordering.

When it comes to financial forecasting, the Power BI and PowerApps integration allow you use advanced analytics algorithms. From there, you can build dynamic and dependable financial forecasting solutions necessary for making decisions and improving your leadership.
As you combine the capabilities of Power BI and PowerApps, users can send quick comments and write feedback. The integration offers you an executive status dashboard that you can use to assign feedback or tasks on the fly. It also enables you to type parameters for specific analysis with ease. You can include not just numbers but also data and text.
Once you are ready to allow your audience access real-time information, the best thing you can do is to integrate Power BI with PowerApps. By doing so, your customers can take advantage of a live view of the latest happenings in your business.
Conclusion
Power BI allows you to connect multiple data sources, model, transform, import, and visualize them. However, you cannot write back to those data sources. This is where PowerApps came into the scene. As you combine Power BI and PowerApps, you have the opportunity to build reliable and helpful analytic solutions. You can even improve the analytic visualization. From your Power BI report, you can act right away. So, you can never underestimate the advantages of integrating these powerful platforms. After completing the integration, be ready for simplified operations while achieving your business needs in no time.
Fill In The Form For – FREE 30 Mins Power BI / Power Apps Consulting


