
For any business these days, big data is a major asset. Nonetheless, it’s just a waste if a business has a huge amount of data and cannot progress or segregate it to produce income. In such a situation, those data set will cause more harm than good. A survey conducted by Forbes found that over 95% of businesses experience some need to handle unstructured data. In another research, over 87% of participants claimed that organizing data was essential to that.
Are you one of those who are having a hard time with the same problem? Power BI dashboards are the solution for you. These dashboards can be a huge help as they help you learn data in a much easier and simpler manner.
Did you know that dashboards can tell a story in a single page view, not to mention it is an interactive tool too? A Power BI is best suitable to make those types of interactive dashboards.
Would you like to know more what are dashboards in Microsoft BI as well as their advantages? Lucky for you, this post will present everything you need to know about this subject. If you’re ready to find out more, let’s dive in!
What are Dashboards in Microsoft Power BI?
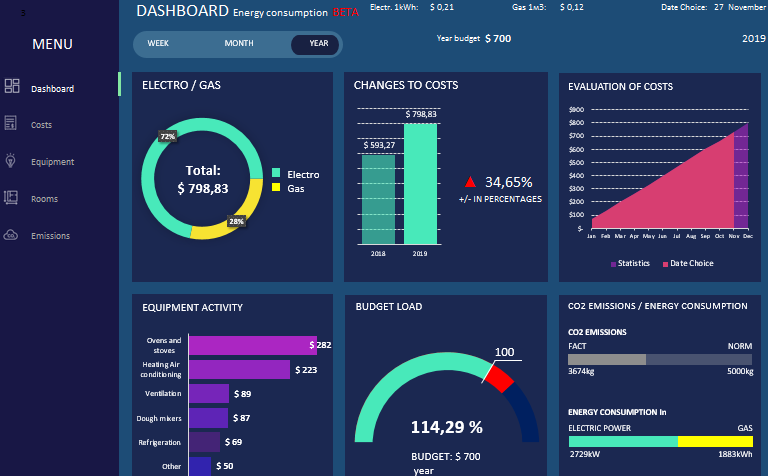
In case you didn’t know, a Power BI dashboard is a single page, sometimes referred to as canvas. It utilizes visualization to convey a story. A well-organized dashboard is composed of the most crucial elements of that story, as it is only limited to a single page.
The visualizations highlighted on the dashboard are known as tiles and are pinned to the dashboard by report designers. Keep in mind that the dashboard’s visualization comes from reports, and every report is based on a single dataset.
You can look at a dashboard as a gateway into the underlying datasets and reports. Choosing a specific visualization will bring you to the report which was utilized to make it.
In short, Power BI Dashboard is a business analytics solution that enables you to see your data and share insights across the company or embed them into your website or app. The solution is composed of different services and products, and the versatility and value come from leveraging the individual elements and taking gain of how they work together.
Advantages of Custom Designed Dashboards
How do you know whether custom-designed dashboards are best for your company? Here are some benefits to start using Power BI Dashboards for Embedded reporting.
Artificial intelligence
Power BI users can access text analytics and image recognition, make machine learning models, and incorporate Azure Machine Learning.
Cortana Integration
What’s more, Power BI works along with Cortana, Microsoft’s digital assistant. Hence, you can verbally ask any questions in your natural language to access graphs and charts. That can be especially useful for users using their mobile devices.
Personalize Security Features
As a report developer, you can set up RLS access filters to make sure viewers only see data and information valuable to them. That helps you mitigate the risk of people seeing information they should not. How great is that?

Modify Power BI App Navigation
Having an app navigation experience offers report developers the freedom to modify navigation to help viewers find content easily and learn the connection between numerous dashboards and Business intelligence reports.
Get Real-Time Data
Dashboards are updated in real-time. That means data is streamed or pushed in, offering viewers the capability to solve issues and determine opportunities as quickly as possible. Any dashboard can highlight and update real-time visuals and data.
Moreover, streaming data sources could be social media sources, factory sensors, or anything from which time-sensitive information can be transmitted or collected.
Simplified Publication & Distribution
Analysts can upload visualizations and reports to the Power BI dashboard service rather than sending big files or uploading them on a shared drive. The best part here is that their data is always refreshed every time the underlying dataset is updated.
A Fast Start
Another advantage of custom-designed dashboards is that you can receive insights immediately with a mess-free and organized setup. You don’t need any necessary training. You will also find included services like Microsoft Dynamics, Google Analytics, and Salesforce, among others.

Difference between Dashboards and Power BI Reports
Just keep in mind that dashboards are practical and useful in visualizing and organizing data in real-time, allowing you to receive valuable insights. On the other hand, Power BI Reports signify a snapshot of a certain business area. They don’t highlight or present real-time data and use tabular charts and bar graphs.
Power BI reports as system dashboards in model-driven apps
User and system dashboards in model-driven apps support certain reporting features along with pre-determined visualization. They are more suitable for transactional data that should be updated on the report. The action happens on the record, or fields are updated on a record in real-time.
Power BI reports bring a plethora of data manipulation and visualization, which everyone has become familiar to use. The capability to easily create reports via Power BI tools, publish such reports, and distribute them to model-driven apps make it simple to offer your company the data in a single place.
It eliminates the necessity to go outside the model-driven or Dynamics application.

Creating Power BI embedded in model-driven apps as a system dashboard
Would you like to add Power BI embedded dashboard? Then you need to do the following:
- Go to the Solutions section in make.powerapps.com. Open or make an existing solution.
- Click New > Dashboards > Power BI embedded.
- Make the dashboard of type Power BI dashboard or report.
- Save and click Publish your new dashboard.
If you want to include a Power BI embedded dashboard to a model-driven app, just follow these steps:
- Make or edit the current model-driven app with the app designer.
- Choose the Dashboards button located on the app designer canvas
- You will find Power BI embedded dashboards grouping on the dashboard’s property sheet. You can then add the applicable dashboards you like.
- Click Save and Publish.
How to create (using tiles) and share your first dashboard in Power BI?
The visualizations pinned on your dashboards came from reports. Hence, it is expected that you have the data exported to Power BI and created your reports before making a dashboard.
For this example, we will use a Power BI sample: Microsoft POS / Retail Analysis Sample.
- You’ll be brought to your workspace, where you can see your datasets, workbooks, reports, and dashboards after you bring in your Power BI data. Select Reports > Retail Analysis Sample.
- Out of all the reports available, let’s think you emphasize the District Monthly Sales. Add the visual about This Years Sales by StoreNumberName to the dashboard.
- You can hover the mouse to pin that visual over it until icons show on the upper-right corner. You can select the pin icon.
Once done, Power BI will prompt you regarding pinning the visual to the dashboard. Choose whether you want to pin it to a new one or an existing dashboard. Choose which one is the existing dashboard. Give a new name if you like a new one.


