

The ability to transform raw information into actionable insights can spell the difference between business success and stagnation. As organizations generate ever-increasing volumes of data, choosing the right tool to visualize and interpret this treasure trove becomes paramount.
Enter SSRS and Power BI – two titans in the realm of reporting and business intelligence. But which is the ideal choice for your organization?
Whether you’re a startup eyeing growth, an enterprise striving for optimization, or simply an enthusiast eager to keep up with BI trends, delving into the strengths, distinctions, and potentialities of these platforms is essential.
Join us as we unpack the intricacies of SSRS and Power BI, helping you make an informed decision for your business’s bright data future. Dive in, and let’s illuminate the path ahead!
What is SSRS?
SQL Server Reporting Services (SSRS) is an enterprise-level reporting platform provided by Microsoft as part of its SQL Server suite. It facilitates the creation, management, and delivery of both traditional paper-driven reports and interactive, web-based reports.
With SSRS, businesses can produce tabular, matrix, graphical, or free-form reports from a range of data sources, including relational databases, multidimensional data sources, and more.
Reports generated using SSRS can be viewed through a web browser, as a Windows application, or exported to various formats like PDF, Excel, and Word. Its robust features and integration with the SQL Server environment make SSRS a favored choice for many enterprises requiring detailed and customizable reporting.
Advantages and Disadvantages of SSRS
Advantages of SSRS:
- Integrated with SQL Server: Being a part of the SQL Server suite, SSRS offers seamless integration with SQL Server databases, allowing for streamlined data retrieval and report generation.
- Flexible Report Design: SSRS provides a Report Builder with a user-friendly interface, enabling the creation of complex and visually appealing reports.
- Export Options: Reports can be exported to various formats, including PDF, Excel, Word, and more, making it easy for users to consume and distribute reports in preferred formats.
Disadvantages of SSRS:
- Learning Curve: Though SSRS offers powerful features, it can be complex for beginners. Those unfamiliar with Microsoft products or SQL might find it challenging to start.
- Web-based Limitations: The default web-based viewer might not be as dynamic or responsive as some modern web apps. It can sometimes have limitations in terms of interactivity and user experience.
- Lack of Advanced Data Visualizations: Compared to newer BI tools, SSRS may not offer the same level of advanced data visualization features.
- Integration with Non-Microsoft Products: While it integrates well with Microsoft products, integrating SSRS with non-Microsoft tools or databases can be more challenging.
What is Power BI?
Power BI is a business analytics tool developed by Microsoft, designed to visualize data and share insights across an organization, or embed them in an application or website.
As a cloud-based service, Power BI provides users with interactive visualizations and business intelligence capabilities using an intuitive interface, allowing users to create reports and dashboards without the need for deep technical expertise.
It integrates seamlessly with various data sources, from simple Excel spreadsheets to complex cloud-based and on-premises hybrid data warehouses.
Advantages and Disadvantages of Power BI
Power BI is an excellent tool for businesses of all sizes seeking dynamic, visually engaging insights. However, like any tool, it’s vital to assess its strengths and weaknesses in the context of organizational needs.
Advantages of Power BI:
- Integration Capabilities: It seamlessly integrates with a plethora of Microsoft products and many other third-party services and platforms.
- Real-time Data Analysis: Power BI allows for real-time data updating and dashboard sharing, facilitating immediate insights.
- Advanced Data Visualization: Offers a variety of modern visualization tools and custom visuals available from its marketplace.
- Regular Updates: Microsoft frequently releases updates, bringing new features and improvements to the platform.
Disadvantages of Power BI:
- Data Size Limitations: Especially in the free version, there’s a data size limit, which might not be suitable for handling extremely large datasets.
- Complexity for Advanced Reports: While it’s user-friendly for basic reports, creating advanced, intricate reports might have a steeper learning curve.
Key Differences Between SSRS vs Power BI
This table provides a concise comparison between SSRS and Power BI in terms of their programming interface and licensing options. Both tools have their unique strengths, and the choice largely depends on the specific business requirements and existing infrastructure.
| Feature/Aspect | SSRS | Power BI |
| Programming Interface | SQL Server Data Tools (Visual Studio) or Report BuilderSQL (Structured Query Language)Supports custom code in VB.NET for report expressions | Power BI DesktopDAX (Data Analysis Expressions) and M (Power Query)Limited to creating custom visuals using SDK |
| Integration | Best with SQL Server databases | Broad range of integrations, including Excel, cloud sources, streaming data, and more |
| Server License Requirements | Requires SQL Server license, with SSRS as an add-on feature | Power BI Service (cloud) requires no server. For on-premises, Power BI Report Server is required. |
| Data Visualization | Basic graphs, tables, and charts | Advanced charts, graphs, maps, and custom visuals |
| Development Environment | SQL Server Data Tools (Visual Studio) or Report Builder | Power BI Desktop |
| Premium License Options | Per-core licensing or Server + CAL (Client Access License) depending on the SQL Server edition | Power BI Pro (per user/month) and Power BI Premium (dedicated cloud resources & capacity pricing) |
SSRS vs Power BI: Which Platform Offers a Better Report Creation Process?
Both SSRS and Power BI Report Server offer robust report creation capabilities, but the process, integration with Visual Studio, and level of manual effort differ. The choice between them largely depends on the specific needs of the user or organization, as well as the existing infrastructure and expertise.
| Feature/Aspect | SSRS | Power BI (Report Server) |
| Manual Effort Required | Often requires a deeper understanding of databases and SQL. Detailed layout adjustments may be needed for pixel-perfect reports. | Generally more user-friendly with its drag-and-drop interface but requires understanding of data modeling using DAX for advanced reports. |
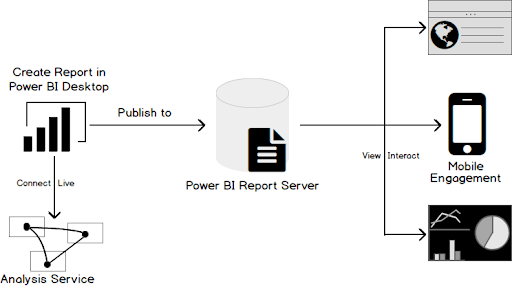
| Creating a Report | Involves using SQL Server Data Tools (or Report Builder), defining data sources, creating datasets, designing the report layout, and setting up parameters. | Involves using Power BI Desktop, connecting to data sources, transforming the data, designing the visual layout, and publishing to Power BI Report Server. |
| Visual Studio Integration | Visual Studio, through SQL Server Data Tools, serves as the primary development environment for creating and managing SSRS reports. | While Power BI Desktop is the primary tool for Power BI report creation, Visual Studio can be used for Analysis Services projects, which can enhance Power BI reporting capabilities. |
| Customization & Extensions | Supports custom assemblies, code embedding, and extensions, especially when using Visual Studio. | Power BI supports custom visuals and themes. Extensions and custom work are more limited compared to SSRS when using Visual Studio. |
| Interactivity & Visualization | Offers standard visualizations with limited interactivity. | Provides a wide range of modern visualizations with high interactivity, including drill-through and slicers. |
| Integration with Other Microsoft Tools | Integrated deeply with the SQL Server ecosystem. | Seamlessly integrates with other Microsoft products and services, especially when linked with Azure services. |
How EPC Group Can Help You Harness the Power of Microsoft Power BI Predictive Analytics
Power BI excels in delivering interactive, visually dynamic dashboards and reports, suitable for today’s fast-paced business environment. It offers a user-friendly drag-and-drop interface, seamless integration with a multitude of data sources, and robust mobile capabilities. While SSRS is apt for traditional, paginated reports, Power BI is geared towards real-time data insights and broad data visualization options.
Our seasoned experts understand the intricacies of data, ensuring that businesses don’t just gather information, but turn it into actionable, future-forward strategies.
By partnering with us, you are not only accessing a tool, but unlocking a comprehensive solution that ensures your data works for you, anticipating market shifts, customer preferences, and operational challenges.
Choosing EPC Group is choosing a commitment to excellence. We pride ourselves on offering tailored solutions that fit seamlessly into your unique business context.
Our approach is grounded in a deep understanding of both technology and business strategy, ensuring that Power BI Predictive Analytics becomes a driving force in your decision-making processes.
As you venture into the world of predictive insights, let EPC Group be your guiding hand, ensuring accuracy, relevance, and a competitive edge. With us, you’re not just predicting the future; you’re shaping it.


