
Two of the frontrunners in this space are Looker and Power BI. While both offer robust features for data analysis, Power BI consistently stands out as the superior choice regarding data visualization capabilities.
From its intuitive interface to its wide array of visualization templates, Power BI has been designed with the user in mind, ensuring clarity and a visually appealing representation of data. As we delve deeper into this comparison, we’ll highlight why many professionals gravitate towards Power BI for their data visualization needs.
What is Looker?
Looker is a modern data exploration and visualization platform that integrates seamlessly with various data sources. As a part of the Google Cloud data and analytics suite, it allows businesses to extract insights from their data in real time.
With its model-driven approach, Looker ensures consistency and reliability across different data explorations and dashboards. Users can create, share, and collaborate on reports and dashboards, enabling data-driven decision-making across organizations.
Looker’s extendable and customizable features ensure that it can cater to diverse business needs, making it a preferred choice for many companies looking to harness the power of their data.
Advantages and Disadvantages of Looker
Like any tool, Looker presents advantages and disadvantages that cater to its diverse user base. Here, we’ll briefly explore its Advantages and Disadvantages:
Advantages of Looker:
- Model-Driven Approach: Looker uses a model-driven design, ensuring consistent definitions across different data explorations and dashboards.
- Real-Time Analysis: Direct access to databases allows for real-time data exploration and reporting.
- Integration Capabilities: Easily integrates with various data sources and third-party applications.
- High Customizability: Allows for developing custom data applications and integrations using Looker’s API.
Disadvantages of Looker:
- Learning Curve: Looker’s unique modeling language (LookML) can have a steep learning curve for new users.
- Cost: Some businesses might find Looker to be pricier, especially compared to other alternatives.
- Performance Lags: For massive datasets, real-time querying can sometimes result in performance issues.
- Complex Set-Up: Initial setup and configuration can be complex, especially model creation in LookML.
- Visualizations: While Looker offers various visualization types, some users feel that its visualization capabilities are less extensive and intuitive than some competitors.
What is Power BI?
Power BI is a data visualization and business analytics tool developed by Microsoft. It empowers users to connect to various data sources, simplify data prep, and drive ad-hoc analysis.
With a suite of powerful visualization tools, users can create interactive reports and dashboards to visualize and share insights across their organizations. Power BI can be used on desktop and cloud platforms, facilitating accessibility and collaboration.
Its integration with other Microsoft products, like Excel and Azure, makes it a cohesive solution for businesses invested in the Microsoft ecosystem. Power BI is renowned for its user-friendly interface, scalability, and deep analytical capabilities.
Advantages and Disadvantages of Power BI
Revered for its robust features and deep integrations, this tool has transformed how businesses interpret data. As we delve deeper, it’s essential to acknowledge both the strengths and limitations that Power BI brings to the table.
Advantages of Power BI:
- User-Friendly Interface: Intuitive design makes it easy, even for non-technical users, to create dashboards and reports.
- Deep Integration with Microsoft Products: Seamless connection with Excel, Azure, and other Microsoft offerings boosts productivity.
- Affordable Pricing: Offers a competitive pricing structure, including a free version.
- Regular Updates: Microsoft’s commitment ensures frequent feature enhancements and improvements.
- Robust Security Features: Offers enterprise-level security and compliance measures.
- Diverse Visualization Options: Extensive charts, graphs, and visualization tools library.
Disadvantages of Power BI:
- Complex DAX: Data Analysis Expressions (DAX) can be challenging to master for some users.
- Performance Issues: Large datasets might occasionally slow down the system.
- Limited Data Source Connections in Free Version: Power BI Desktop might not cover all external data source connections.
- Steep Learning Curve for Advanced Features: While basic operations are user-friendly, advanced functionalities require significant training.
Key Differences Between Power BI And Looker
Both tools, developed by tech giants Microsoft and Google Cloud, bring unique strengths and capabilities. In exploring their fundamental differences, one can better understand their appeal and potential fit for specific business needs.
| Criteria | Power BI | Looker |
| Developer | Microsoft | Google Cloud |
| Primary Focus | Business analytics and data visualization | Data exploration and visualization |
| Interface | User-friendly, often catered to non-technical users | More tailored towards users with a data background |
| Integration | Deep integration with Microsoft products (Excel, Azure, etc.) | Integrates well with various databases and supports third-party applications |
| Pricing | Offers both free and paid versions with a competitive pricing structure | Typically viewed as more expensive, especially for large datasets |
| Customization Language | DAX (Data Analysis Expressions) | LookML (Looker’s modeling language) |
| Deployment | Available on desktop (Power BI Desktop) and cloud (Power BI Service) | Cloud-native platform |
| Visualization Options | Extensive library of visualizations with an option to import custom visuals | Solid visualization capabilities, but some users might find Power BI’s options more extensive or intuitive |
| Scalability | Suitable for a range of business sizes, from small to large enterprises | Highly scalable, especially for large datasets, being cloud-native |
| Learning Curve | It is relatively easy for basic operations, but DAX can be challenging | A steeper initial curve, especially for understanding and working with LookML |
| Mobile Integration | Has a dedicated mobile application for on-the-go access | Mobile view is available but might not be as feature-rich as Power BI’s mobile app |
| Security | Robust security features with Microsoft’s enterprise-grade security | Equipped with strong security features, especially given its association with Google Cloud |
| Real-time Data Exploration | It is possible, but it might require additional configurations or tools | One of its standout features enabling direct real-time data exploration |
Looker vs Power BI: Analyzing the Key Technical Features
Looker and Power BI, two powerhouses in the data analytics landscape, offer distinct technical features catering to various business needs. While both tools aim to deliver profound insights from data, their approaches, functionalities, and integrations differ significantly. Let’s delve deep into a comparative analysis of their key technical attributes.
Data Modeling Language and Natural Language Query Tool
Looker:
Data Modeling Language: LookML
- Looker employs a proprietary language called LookML for data modeling. This YAML-based language allows for creating consistent definitions and metrics across the platform.
- LookML models are source-control friendly, enabling teams to manage versions and collaborate efficiently.
- While powerful, there’s a learning curve to grasp LookML, especially for those unfamiliar with YAML or SQL-like languages.
Natural Language Query Tool:
- Looker provides basic natural language processing (NLP) capabilities for querying. This allows users to ask questions in plain English and get insights. However, the feature is less deeply integrated than in some other platforms.
Power BI:
Data Modeling Language: DAX (Data Analysis Expressions)
- Power BI uses DAX as its primary data modeling and formula language. DAX is akin to Excel formulas but is enhanced for data modeling and analytics.
- While powerful, DAX can be intricate and requires some learning, especially for complex calculations.
Natural Language Query Tool: Q&A Feature
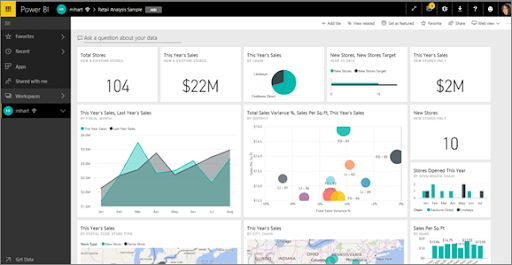
- Power BI’s Q&A feature stands out, enabling users to instantly pose questions in natural language and receive visualized answers. For example, users can type “Sales for last month” and get an immediate chart or figure.
- The Q&A visualization tool also provides suggestions and autocorrects, making the querying process smoother.
Visualization Tools and Interactive Dashboards
Looker:
Visualization Tools:
- Looker offers a diverse set of standard visualizations out of the box, such as bar charts, scatter plots, and pie charts.
- Users can create custom visualizations using JavaScript, allowing for high customization for specific needs.
Interactive Dashboards:
- Dashboards in Looker are highly customizable and interactive. Filters, drill-downs, and links are easy to set up, offering a dynamic data exploration experience.
- Collaboration is a strength for Looker, as users can easily share, comment, and schedule dashboard deliveries.
Power BI:
Visualization Tools:
- Power BI boasts a comprehensive gallery of visualizations, with the added benefit of a marketplace where users can download custom visuals created by the community.
- The drag-and-drop interface in Power BI makes it straightforward to create, modify, and arrange visualizations.
Interactive Dashboards:
- Dashboards in Power BI are intuitively designed with a focus on interactivity. Clicking on one visualization can automatically filter and adjust other related visuals on the same report, creating a seamless exploration flow.
- Power BI’s integration with other Microsoft tools allows for enhanced collaboration, especially with tools like Teams and SharePoint. This ensures a well-connected ecosystem for sharing and discussing insights.
Streaming Analytics and Self-Service Analytics
Looker:
Streaming Analytics:
- Looker does offer real-time analytics capabilities, especially when paired with databases that support real-time data processing.
- While not inherently a streaming platform, Looker’s architecture allows for real-time querying the database, making it feasible to reflect live data changes.
Self-Service Analytics:
- One of Looker’s core strengths is its self-service capabilities. Its platform is built around the idea of democratizing data access.
- Users can create, modify, and save their visualizations and analyses with the Explore section, fostering a culture of data-driven decision-making across departments.
- The user-friendly interface and drill-down capabilities allow users to explore datasets deeply without extensive technical knowledge.
Power BI:
Streaming Analytics:
- Power BI offers explicit support for streaming datasets. It provides real-time dashboards that can reflect data changes instantly.
- With Power BI, users can stream data and update dashboards in real time, making it apt for monitoring live metrics, like IoT device readings or live website interactions.
Self-Service Analytics:
- Power BI is renowned for its user-friendly interface, which promotes self-service analytics. With Power BI Desktop, users can build reports and dashboards without deep technical expertise.
- The platform provides an intuitive drag-and-drop experience, making it easy for users to connect to datasets, transform data, and visualize insights.
- Power BI’s Q&A feature further bolsters its self-service capabilities, allowing users to ask natural language questions and get visualized answers.
How EPC Group Can Help You Harness the Power of Microsoft Power BI Predictive Analytics
Power BI stands out due to its seamless integration with the Microsoft ecosystem, ensuring a streamlined flow between applications most businesses already utilize. The platform’s intuitive user interface and rich visualization capabilities make it more accessible for teams across various skill levels.
Moreover, its competitive pricing and robust security features, backed by Microsoft’s enterprise-grade infrastructure, further solidify its position as a top choice. While Looker has its merits, Power BI’s holistic approach to data visualization and analysis is unmatched, especially for businesses already entrenched in Microsoft’s suite of tools.
With its extensive expertise in data solutions, EPC Group stands as your trusted partner to unlock the full potential of Microsoft Power BI Predictive Analytics.
Leveraging Power BI’s capabilities, we help organizations transform raw data into actionable insights, allowing them to confidently anticipate market shifts, optimize operations, and make strategic decisions.
Our team of seasoned experts collaborates closely with your organization, ensuring that your data is visualized and drives tangible business value and competitive advantage.
Refrain from letting valuable insights sit latent in your datasets. Join hands with EPC Group to harness the transformative power of Power BI Predictive Analytics and lead your industry with data-driven foresight.
Contact EPC Group now and embark on your journey to a brighter, more predictive, and more proactive business future.


