
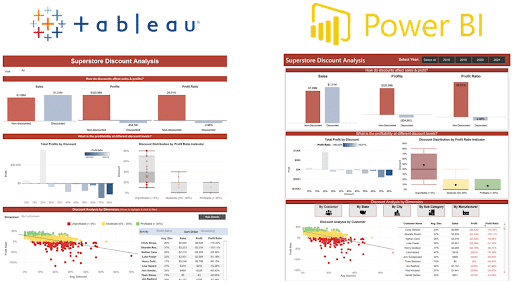
Power BI and Tableau, leading Business Intelligence (BI) tools, offer comprehensive data visualization and analytical capabilities.
Determining cost-effectiveness between these tools depends on multiple factors, such as licensing structure, integration capabilities, scalability, and specific business requirements.
This analysis provides a concise overview of the salient features, pricing models, and other influential factors to aid businesses in making an informed decision on the optimal solution for their needs.
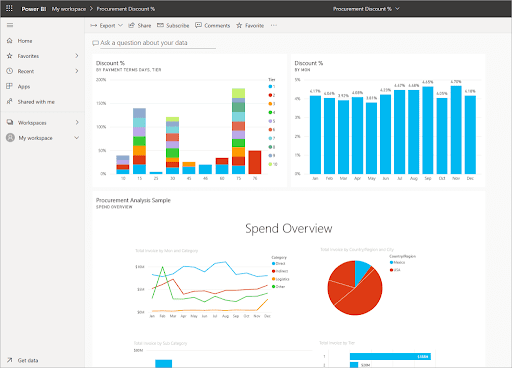
What is Power BI?
Power BI is a business analytics tool developed by Microsoft that specializes in data visualization and business intelligence. It allows users to connect to various data sources, from simple Excel spreadsheets to more intricate cloud-based and on-premises hybrid systems.
Once connected, Power BI provides tools like Power Query to clean and transform this raw data into actionable insights. These insights can then be visualized through customizable reports and interactive and responsive dashboards. Power BI’s distinct advantage is its ability to integrate advanced analytics through functionalities like DAX (Data Analysis Expressions) and custom measures.
The platform promotes collaboration; its cloud-based variant, Power BI Service or Power BI Pro, allows for seamless sharing, collaboration, and publishing of reports across an organization. Designed with a user-friendly interface, Power BI aims to be an accessible analytical tool catering to technical and non-technical users.
What is Tableau?
Tableau, a product of Tableau Software under Salesforce, is a data visualization tool often compared with Microsoft’s Power BI. While it’s known for its intuitive user interface and versatile data visualization capabilities, several factors might give Power BI an edge for certain businesses. Tableau allows users to connect to many data sources and construct detailed, interactive dashboards.
Power BI often emerges as a more economical choice when considering cost, especially for businesses already invested in the Microsoft ecosystem. Integration-wise, Power BI’s seamless compatibility with other Microsoft products, like Azure, Excel, and SharePoint, provides a more streamlined experience.
For users familiar with Excel, transitioning to Power BI might be more straightforward than adapting to Tableau’s interface. While Tableau has a robust feature set and offers advanced visualization techniques, businesses might find Power BI as a more cohesive fit within a Microsoft-centric environment.
Key Differences Between Power BI vs Tableau
| Features | Power BI | Tableau |
| Developer | Developed by Microsoft, a global leader in software and cloud solutions. | Owned by Salesforce after acquisition. |
| Pricing | Generally more affordable, ideal for businesses wanting cost-effective solutions. Integrated with other Microsoft products for potential cost savings. | Often pricier, especially for large-scale deployments. |
| Integration | Seamless with Microsoft products, ensuring a cohesive business solution for companies already in the Microsoft ecosystem. | Good integration capabilities, but might require additional steps for non-Salesforce products. |
| Ease of Use | Familiar interface for those used to Microsoft tools. The lower learning curve for Excel users. | Though intuitive, it may present a steeper learning curve for those unfamiliar with its layout. |
| Visualization | Offers a wide range of visualization options, focusing on simplicity and ease of use. | Advanced visualization, but may require more expertise for customization. |
| Data Handling | Highly optimized for medium datasets and has tight integration with Azure for big data solutions. | Handles large datasets effectively but might not offer the same level of integration with business-specific tools as Power BI. |
| Community & Support | Backed by Microsoft’s vast resources and community, ensuring consistent updates and support. | Has an active community, but the support and resources of Microsoft give Power BI an edge. |
| Deployment | Comprehensive solutions with both desktop and cloud offerings, allowing for flexibility and scalability. | Diverse offerings, but businesses might find Power BI’s deployment options more cohesive with existing infrastructures. |
| Advanced Analytics | Uses the robust DAX language, allowing for intricate analytics within the familiar Microsoft framework. | Offers advanced features but lacks the integration of a language like DAX that’s deeply rooted in a well-established ecosystem. |
Features of Power BI vs Tableau
Power BI and Tableau are leading business intelligence tools that offer advanced data visualization and analytics. While both cater to similar needs, their features, integration capabilities, and pricing structures vary, with Power BI notably benefiting from its Microsoft integration.
Features of Power BI
- Integrated Ecosystem: Being a Microsoft product, Power BI boasts seamless integration with other Microsoft offerings, including Azure, Excel, and SharePoint. This provides businesses with a cohesive data solution without needing third-party connectors or extensive configurations.
- Affordability: For businesses, especially SMEs, Power BI often emerges as a more economical choice, particularly if they are already using other Microsoft services.
- DAX Language: Power BI incorporates the Data Analysis Expressions (DAX) language, enabling users to perform intricate calculations and analytics within a familiar Microsoft framework.
- User-friendly Interface: Power BI’s interface is specifically designed for ease of use, making it particularly accessible for users familiar with Microsoft Office tools like Excel.
- Optimized Data Handling: Power BI is particularly efficient with medium-sized datasets and offers robust integration with Azure-based big data solutions.
- Regular Updates: Microsoft consistently rolls out updates for Power BI, ensuring that the tool is always equipped with the latest features and security protocols.
Features of Tableau
- Advanced Visualization: While Tableau is recognized for its advanced data visualization capabilities, some of these features might require a steeper learning curve for users unfamiliar with the platform.
- Data Source Connections: Tableau provides a wide range of data source connections but may require additional configurations when integrating with non-Salesforce products.
- Deployment Options: Tableau offers various deployment methods such as Tableau Desktop and Tableau Server. However, businesses deeply embedded in the Microsoft ecosystem might find Power BI’s deployment more aligned with their existing infrastructure.
- Community Support: Tableau does have an active community. However, Power BI, with Microsoft’s vast resources and global reach, often provides more extensive official support and resources.
Power BI vs Tableau: Exploring the Best Data Visualization Tools for Business Intelligence
Both Power BI and Tableau are leading tools in the Business Intelligence (BI) sector. This document will provide a technical exploration of the data visualization capabilities inherent to both tools, with a bias towards Power BI. It is imperative to remember that while both tools are competent in their own right, the chosen tool must align with an organization’s specific needs and goals.
Power BI: Data Visualization Features
- Custom Visuals: Power BI allows users to either select from a suite of built-in visuals or import additional custom visuals from the Power BI marketplace. These visuals can be tailored to match a company’s branding or specific data representation needs.
- Drillthrough and Drill Down: Users can interact with visuals to drill down to more granular data or navigate to another report page, providing detailed insights without being overwhelmed with too much data upfront.
- Quick Insights: By simply right-clicking on a dataset, users can leverage the Quick Insights feature to generate a series of automatic visualizations, assisting in identifying potential trends or anomalies in the data.
- Power BI Q&A: This is a natural language processing tool that lets users type a query and automatically generates a corresponding visualization.
- Conditional Formatting: Enables the visualization of data metrics in different colors, scales, or formats based on defined conditions, which aids in quickly identifying outliers or specific trends.
- Geospatial Visualizations: Power BI integrates seamlessly with Bing Maps to render geographical data, making plotting data points on a map easy.
Tableau: Data Visualization Features
- Show Me: This feature provides recommendations for the most suitable types of visualizations based on the data selected.
- Dynamic Dashboards: Tableau offers the ability to create interactive dashboards which can adjust and change in real time based on user interactions or live data updates.
- Data Blending: When data sources don’t naturally link together, Tableau’s data blending feature allows users to combine them and visualize the collective data.
- Reference Lines and Forecasting: Users can add reference lines, bands, distributions, and forecasts to their visualizations to provide additional context and predictive insights.
Exploring the Data Sources in Power BI and Tableau: Which is Better?
Power BI and Tableau, two frontrunners in the Business Intelligence (BI) domain, excel in integrating with various data sources. This document seeks to provide a technical exploration of the data source capabilities intrinsic to both tools, emphasizing the strengths of Power BI.
While both platforms deliver competent data source integration, the decision ultimately pivots on an organization’s specific needs and infrastructure.
Power BI: Data Source Integration
- Microsoft Products: Power BI displays an unparalleled integration with Microsoft tools like Excel, SQL Server, Azure SQL Database, Azure Data Lake Storage, and more. This integration is seamless and efficient for companies already leveraging Microsoft’s ecosystem.
- Web-Based Sources: Power BI offers native connectors for platforms like SharePoint, Dynamics 365, and even non-Microsoft services like Salesforce and Google Analytics.
- On-Premises Sources: The Power BI Gateway facilitates connections to on-premises data sources, ensuring data remains up-to-date without moving it to the cloud.
- Advanced Dataflows: Power BI provides capabilities to build complex ETL (Extract, Transform, Load) processes with Power Query, allowing users to manipulate and transform data before it’s used in a report.
- Custom Connectors: If native connectors are insufficient, Power BI permits the development of custom connectors using the Power Query M formula language.
- Streaming Data: Power BI offers real-time data streaming capabilities for real-time analytics, integrating with platforms like Azure Stream Analytics.
Tableau: Data Source Integration
- Database Connectivity: Tableau supports an array of databases like MySQL, Oracle, AWS Redshift, SQL Server, and more.
- File Formats: Direct import from Excel, JSON, PDF, Spatial files, and statistical files like SAS, R, and SPSS is supported.
- Web Data Connectors: Through this feature, Tableau can connect to any data available over HTTP, including internal web services, JSON, and REST APIs.
- ODBC: By utilizing the Open Database Connectivity (ODBC) protocol, Tableau can connect to other data sources not natively supported.
Exploring the Range of Chart Types in Power BI and Tableau
In the Business Intelligence (BI) domain, chart variety plays a pivotal role in data representation and analysis. Power BI and Tableau offer a diverse range of chart types, ensuring users can visualize their data in numerous ways. This document will provide a technical exploration of the chart types present in both tools, emphasizing Power BI’s offerings.
Power BI: Chart Types
- Basic Charts: Power BI offers standard chart types such as column/bar, line, and pie/doughnut charts.
- Matrix and Table: These formats are optimal for displaying data in tabular forms, with conditional formatting options for enhanced clarity.
- Card and Multi-Row Card: These visuals provide a high-level view of a single or multiple metrics.
- Maps: Power BI offers multiple geospatial visualizations, including filled maps, bubble maps, and even ArcGIS maps for advanced geographical data representation.
- Scatter and Bubble Plots: Ideal for representing correlations between variables.
- Gauges and KPIs: These allow tracking performance metrics against set targets or benchmarks.
- Waterfall Chart: Useful for understanding the sequential contribution of different items, such as financial data.
Tableau: Chart Types
- Standard Charts: Tableau provides basic visualization types like bar, line, area, and pie charts.
- Gantt Charts: Used primarily for time tracking or showcasing the duration of events.
- Heat Maps: Ideal for showcasing density or intensity across variables.
- Treemaps: Helpful for representing hierarchical data and part-to-whole relationships.
- Box Plots: Used to depict the distribution of a dataset.
- Histograms: Represent the distribution of a single variable.
- Geographic Maps: Tableau too offers geospatial visualizations for geographical data plotting.
Simplifying Data Analysis: Power BI vs Tableau Intuitive Interfaces
User interfaces determine how efficiently users can conduct data analysis. Power BI and Tableau, two contenders in the Business Intelligence (BI) domain, have designed their platforms with data analysis at the forefront. This document provides a technical exploration of the data analysis interfaces in both tools, emphasizing the strengths of Power BI.
Power BI: Data Analysis Interface
- Ribbon Interface: Power BI’s interface, reminiscent of other Microsoft Office products, offers a familiar Ribbon at the top, making it intuitive for those accustomed to Microsoft’s ecosystem.
- Drag-and-Drop Functionality: Users can easily drag fields onto the canvas or into values, axes, and filter areas, streamlining the visualization creation process.
- Quick Measures: Allows users to automatically create common calculations without delving into DAX (Data Analysis Expressions) formulas.
- Data View and Model View: The interface provides distinct views for data manipulation and model relationships, ensuring clarity and ease of use.
- Smart Narratives: This feature automatically generates textual explanations of the trends and patterns in the data, simplifying interpretation for non-technical users.
- Q&A Box: The natural language querying tool where users can type questions and receive visual answers, making data exploration and analysis efficient and user-friendly.
Tableau: Data Analysis Interface
- Shelves and Cards Interface: Tableau operates with a series of “shelves” and “cards” where users drag and drop dimensions and measures to create visualizations.
- Show Me Panel: A panel that suggests appropriate visualizations based on selected data attributes.
- Dual Axis and Blended Axis: Tableau can combine two measures into a single chart for comparative analysis.
- Instant Tooltips: Hovering over data points provides a tooltip that showcases detailed information about that specific point.
- Context Filters: Users can create context filters to focus on specific subsets of data for more in-depth analysis.
Ensuring Data Privacy and Security in Power BI vs Tableau
In the era of digital information, ensuring data privacy and security in Business Intelligence (BI) tools is paramount. Power BI and Tableau, leading contenders in the BI domain, both prioritize these concerns. This document offers a technical exploration of the data privacy and security mechanisms in both tools, emphasizing the strengths of Power BI.
Power BI: Data Privacy and Security
- Integration with Microsoft Security: Power BI’s inherent integration with the comprehensive Microsoft security model enhances its security robustness. It benefits from Microsoft’s vast experience securing data and services like Office 365 and Azure.
- Row-Level Security (RLS): Power BI provides RLS, allowing administrators to control data access at row levels based on user roles and profiles.
- Data Encryption: Data in Power BI is encrypted at rest and in transit. It uses Azure Blob Storage for data at rest, and it employs HTTPS and TLS for data in transit.
- Audit Logs: Administrators can access detailed logs showing user activities, providing insights into how data is accessed and by whom.
- Compliance Standards: Power BI adheres to global standards, including ISO 27001, HIPAA, and GDPR, ensuring data handling aligns with international best practices.
- On-premises Data Gateway: For businesses not comfortable with cloud storage, Power BI offers a gateway solution to keep data sources on-premises while still allowing for cloud-based reporting.
Tableau: Data Privacy and Security
- User Filters: Similar to RLS in Power BI, Tableau provides user-based filters to control access to specific data rows.
- Data Encryption: Tableau ensures data encryption both at rest and in transit.
- Advanced Server Security: Tableau Server has robust security features, including network security, user authentication, and group-based permissions.
- Audit Trails: Tracks and records user activity on the platform, enabling administrators to monitor data access patterns.
- External Authentication: Tableau supports integration with external authentication providers, including Active Directory, Kerberos, and more.
Cost of Using Power BI vs Tableau
Power BI and Tableau, two leading contenders in the BI domain, offer different pricing structures catering to various business needs. The following tabular representation provides a concise breakdown of the costs associated with each platform.
| Feature/Version | Power BI | Tableau |
| Desktop Version | Power BI Desktop: Free | Tableau Public: Free |
| Individual User License | Power BI Pro: ~$9.99/user/month | Tableau Explorer: ~$35/user/month (for hosted version) |
| Capacity and Premium Features | Power BI Premium: Starting at ~$20,000/month (dedicated cloud capacity) | Tableau Server: Contact sales (on-premises or public cloud) |
| Cloud Service | Power BI Service: Included with Pro and Premium | Tableau Online: ~$42/user/month (cloud service) |
| Embedded Analytics | Power BI Embedded: Based on node hours | Tableau Embedded: Based on deployment & users |
| Data Refresh Frequency | Power BI Service: Hourly for Pro, 48x/day for Premium | Tableau Online: Daily or as per extract refresh schedule |
Power BI or Tableau: Making the Right Choice for Your Data Analytics Needs
Choosing the right Business Intelligence (BI) tool is crucial for effectively analyzing, visualizing, and deriving insights from data. Power BI and Tableau, being dominant forces in the BI domain, have their own advantages and disadvantages. This tabular representation aims to highlight these aspects, with a tilt in favor of Power BI.
| Criteria | Power BI (Advantages) | Power BI (Disadvantages) | Tableau (Advantages) | Tableau (Disadvantages) |
| Integration | Seamlessly integrates with Microsoft products like Excel, Azure, and Dynamics 365. | Might face challenges with non-Microsoft tools. | Supports a wide range of data sources. | Less native integration with Microsoft products. |
| Learning Curve | Familiar interface for Microsoft Office users, reducing the learning curve. | It might be less intuitive for non-Microsoft users. | Robust community and resources for learning. | The steeper learning curve for advanced functionalities. |
| Pricing | Offers a competitive entry-level pricing with a free desktop version. | Premium features require significant investment. | Flexible pricing for large enterprises. | Often perceived as costlier, especially for small businesses. |
| Customization & Flexibility | Extensive custom visual marketplace and development tools are available. | Some limitations in default visual customization. | Highly customizable visualization options. | Requires more expertise to harness full customization power. |
| Performance & Scalability | Optimized for performance with Microsoft’s infrastructure and Power Query. | Might face performance issues with extremely large datasets. | Known for handling large datasets efficiently. | Licensing can become expensive as scalability needs grow. |
| Natural Language Querying | Q&A feature allows for natural language data querying, enhancing user experience. | Limited to specific data models and visual types. | Limited natural language capabilities. | More intuitive in handling natural language queries. |
| Security & Compliance | Benefits from Microsoft’s vast security infrastructure and global compliance standards. | Configuration nuances might expose data vulnerabilities. | Robust security features. | Compliance integration may not be as extensive as Power BI. |
| Mobile Experience | Dedicated mobile app with tailored dashboards and reports. | Some features may need to be more responsive on mobile. | The mobile app is available with interactive features. | Some visualizations might not render perfectly on mobile. |
While both Power BI and Tableau offer robust data analytics solutions, the choice often concerns specific organizational needs, existing infrastructure, and budget considerations. With its seamless integration into the Microsoft ecosystem, competitive pricing, and features tailored for a diverse user base, Power BI often emerges as a favorable choice for many businesses.
Why Choose EPC Group for Power BI Consulting and Support?
We stand out as a beacon in Power BI consulting and support. With our vast experience spanning over two decades, we have demonstrated unparalleled expertise in crafting tailored BI solutions. Our team of seasoned professionals ensures that every Power BI implementation is optimized for performance, security, and scalability.
We don’t merely provide a service; we partner with organizations, ensuring that every BI initiative aligns perfectly with the organization’s objectives, offering insights that drive tangible business outcomes.
Choosing us for Power BI consulting and support is choosing a legacy of excellence. Our track record of successfully navigating complex BI challenges speaks volumes about our capability to handle diverse business needs.
Suppose you want to unlock the full potential of Power BI and ensure that your data works for you, we are your go-to solution. Dive into a world of seamless data integration, actionable insights, and robust support. Empower your decision-making with EPC Group today!


